What Does Insurance Score Do And How It Shapes Coverage

Table of Contents
- Definition and Core Function of Insurance Scores
- Key Factors Influencing Insurance Score Calculation
- Comparison of Risk Factors in Insurance Scores
- Risk Tier Categorization Based on Insurance Scores
- How Insurance Scores Influence Pricing and Policy Terms
- Step-by-Step Process of Applying Insurance Scores to Premium Determination
- Mathematical Models and Actuarial Techniques Used in Premium Adjustment
- Legal and Ethical Considerations in Score-Based Pricing
- Data Sources and Collection Methods for Insurance Scores
- Primary Data Sources for Insurance Scores
- Data Collection Pipeline: Flowchart Representation
- Role of Telematics and IoT in Dynamic Insurance Scoring
- Data Types, Collection Methods, and Privacy Considerations
- Consumer Rights and Score Transparency in Insurance Scoring
- Legal Frameworks Governing Insurance Score Disclosure
- Steps to Request and Review an Insurance Score
- Red Flags Indicating Potential Errors in Insurance Scores
- Checklist for Improving Insurance Scores
- Industry Variations in Insurance Scoring Methodologies
- Scoring Methodologies Across Insurance Types
- Comparative Analysis of Scoring Factors
- Case Study: A Consumer’s Divergent Insurance Scores
- Emerging Trends in Insurance Scoring
- Tools and Technologies Behind Insurance Score Calculations
- Machine Learning Algorithms in Insurance Score Generation
- Predictive Modeling Software and Libraries
- Load and preprocess data
- Train model with weighted features
- Feature Selection and Weighting in Insurance Scoring
- Big Data Platforms for Real-Time Insurance Scoring
Insurance scores serve as a critical yet often misunderstood metric that determines the financial and coverage outcomes for policyholders across industries. Unlike traditional credit scores, these assessments evaluate risk through a tailored lens, incorporating claims history, behavioral patterns, and demographic insights to influence premiums and policy terms. By quantifying individual risk profiles, insurers leverage these scores to balance fairness with profitability, yet their application raises questions about transparency, accuracy, and ethical implications. This exploration dissects the mechanics of insurance scoring, from data collection to consumer rights, while examining how variations in methodologies impact auto, home, and health insurance markets.
The foundation of insurance scoring lies in its ability to translate complex risk factors into actionable insights for underwriters. While credit scores assess financial responsibility, insurance scores prioritize predictive behavior—such as frequency of claims, policy adherence, or even real-time driving metrics. These factors are systematically weighted and analyzed using actuarial models and machine learning, enabling insurers to categorize policyholders into distinct risk tiers. The result is a dynamic pricing framework where a single score can dictate annual premiums, coverage limits, or eligibility for discounts, underscoring its pivotal role in the insurance ecosystem.
Definition and Core Function of Insurance Scores
Insurance scores serve as predictive analytics tools designed to assess the likelihood of a policyholder filing a claim or incurring losses, enabling insurers to tailor premiums and underwriting decisions with greater precision. Unlike credit scores, which primarily evaluate financial responsibility and repayment risk, insurance scores focus on behavioral, historical, and contextual risk factors specific to insurance claims. These scores integrate proprietary algorithms developed by insurers or third-party providers to quantify risk exposure, ensuring fairness while mitigating adverse selection.
The primary distinction between insurance and credit scores lies in their data sources and predictive objectives. While credit scores rely on borrowing history, payment behavior, and credit utilization, insurance scores analyze claim frequency, policy compliance, demographic trends, and even external factors like geographic risk. This differentiation allows insurers to dynamically adjust pricing models, reflecting real-time risk assessments rather than static financial metrics.
Key Factors Influencing Insurance Score Calculation
Insurance scores are derived from a multifaceted evaluation of policyholder data, categorized into behavioral, historical, and demographic segments. Behavioral factors assess how individuals interact with their policies, such as adherence to safety protocols or timely claim reporting. Historical data examines past claim patterns, severity, and frequency, while demographic variables—including age, location, and occupation—provide contextual risk insights. The weighting of these factors varies by insurer and policy type, with some placing greater emphasis on claims history for auto insurance and medical records for health coverage.Example of Weighted Factors:The integration of these factors into an insurance score is governed by statistical models that prioritize predictive accuracy over correlation. For instance, a driver’s adherence to telematics data (e.g., speeding or hard braking) may carry more weight than credit score alone in determining auto insurance premiums. Similarly, health insurers may prioritize pre-existing conditions and preventive care metrics over traditional credit-based underwriting.
"A policyholder with a history of three minor auto accidents in five years may receive a higher risk score than one with no claims, even if both have identical credit scores."
Comparison of Risk Factors in Insurance Scores
The following table outlines the primary factor types contributing to insurance scores, their relative weight in calculations, example metrics, and their direct impact on premiums. The weights are illustrative and may vary by insurer or region, but they reflect industry-standard practices.| Factor Type | Weight in Score | Example Metrics | Impact on Premiums |
|---|---|---|---|
| Claims History | 30–40% |
|
|
| Policy Behavior | 25–35% |
|
|
| Demographic Data | 15–25% |
|
|
| External Risk Indicators | 10–20% |
|
|
Risk Tier Categorization Based on Insurance Scores
Insurers segment policyholders into risk tiers using insurance scores to apply differentiated underwriting standards and pricing structures. These tiers—typically labeled as low-risk, medium-risk, and high-risk—determine eligibility for coverage, premium levels, and policy terms. The classification process leverages percentile rankings within a given insurer’s customer base, where scores are normalized to a standard distribution (e.g., 30th percentile = low-risk, 70th percentile = high-risk).Risk Tier Definitions:The implications of tier classification extend beyond premium adjustments:
"Low-risk (0–30th percentile): Policyholders with minimal claims history, strong policy compliance, and favorable external risk factors. Medium-risk (31–70th percentile): Average claim frequency, mixed policy behavior, or moderate external exposure. High-risk (71–100th percentile): Frequent or severe claims, poor compliance, or high external risk exposure."
For instance, a driver with a clean record and a low insurance score might pay $800 annually for full coverage, while a high-risk driver with multiple at-fault accidents could face a premium of $2,500+, plus mandatory attendance at a defensive driving course. Similarly, homeowners in wildfire-prone areas may see their scores downgraded to high-risk unless they invest in fire-resistant roofing or evacuation plans.
The tiering system also influences renewal decisions; insurers may non-renew high-risk policies if the cumulative risk outweighs the insurable interest. Conversely, low-risk policyholders are often retained through automatic renewal with discounts or personalized service tiers.
How Insurance Scores Influence Pricing and Policy Terms
Insurance scores serve as a quantitative foundation for risk assessment, directly impacting the financial and contractual terms of policies across auto, home, and health insurance sectors. By integrating predictive analytics and actuarial science, insurers translate individual risk profiles into premium adjustments, policy exclusions, or coverage tiers. The process involves statistical modeling to correlate behavioral, credit, and claim history data with future risk likelihood, ensuring pricing reflects both individual and broader market trends.The application of insurance scores is not merely a pricing mechanism but a systematic approach to balancing profitability with fairness. Actuarial models dynamically weigh score ranges against historical claim data, enabling insurers to segment policyholders into risk categories. Below is a structured breakdown of how these scores translate into tangible financial and contractual outcomes, including the mathematical frameworks underpinning adjustments and the ethical considerations governing their use.
Step-by-Step Process of Applying Insurance Scores to Premium Determination
The integration of insurance scores into premium calculation follows a multi-stage workflow, combining data aggregation, statistical modeling, and regulatory compliance. Insurers begin by collecting structured and unstructured data—such as credit scores, driving records, or medical histories—before applying proprietary algorithms to derive a composite risk score. This score is then mapped to predefined actuarial tables or machine-learning models to estimate the probability of claims. The final premium is derived by applying a base rate, adjusted for the score’s risk tier, regional cost-of-living indices, and policy-specific factors (e.g., deductible levels).Key stages in the process:
1. Data Collection and Normalization
Insurers gather data from internal (e.g., past claims) and external sources (e.g., credit bureaus, motor vehicle reports). This data undergoes normalization to standardize variables (e.g., scaling credit scores from 300–850 to a 0–1000 range) and mitigate biases. For example, a driver’s traffic violation history may be weighted differently in urban vs. rural areas due to varying accident rates.
2. Score Calculation and Risk Stratification
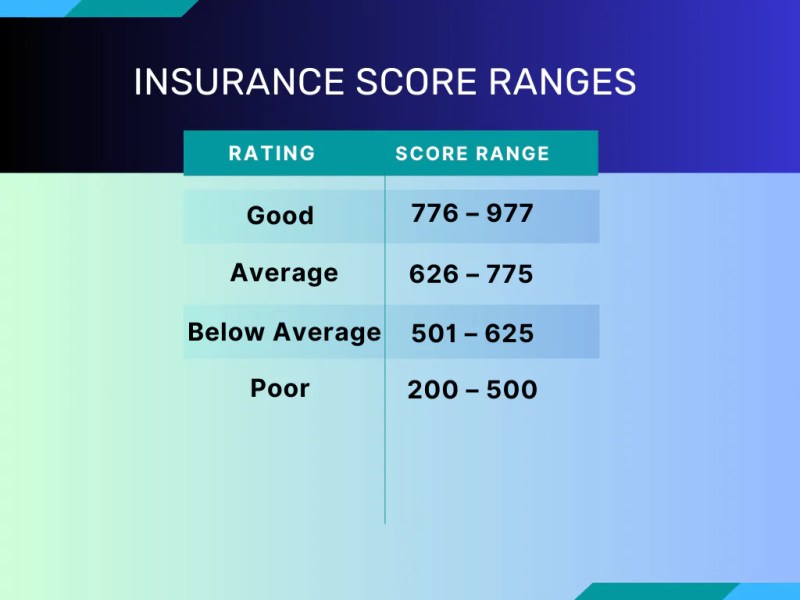
Algorithms (e.g., logistic regression, gradient boosting) process the normalized data to generate an insurance score. Scores are typically binned into tiers (e.g., "Low," "Medium," "High Risk"), each corresponding to a premium multiplier. A score of 750 might fall into the "Medium-Low" tier, while 550 could trigger a "High Risk" classification with a 30% premium surcharge.
3. Actuarial Modeling and Base Premium Adjustment
Insurers use actuarial tables—mathematical representations of claim probabilities—to assign a base premium for each risk tier. For instance, a driver with a score of 800 (low risk) might have a base premium of $600, while a score of 600 (high risk) could increase this to $900. The adjustment is derived from historical data showing that high-risk scorers file claims at a rate 40% higher than low-risk peers.
4. Regional and Policy-Specific Overlays
The raw score-derived premium is further refined using geographic cost factors (e.g., higher theft rates in urban areas) and policy terms (e.g., a $1,000 deductible may reduce premiums by 15%). For example, a homeowner in a flood-prone zone with a high insurance score might still face a 25% premium increase due to location-specific risks.
5. Dynamic Pricing and Reassessment
Many insurers employ dynamic pricing models that reassess scores periodically (e.g., annually or after major life events). A policyholder improving their score (e.g., through a safe driving record) may see premiums decrease by 10–20% at renewal, while a decline (e.g., a DUI) could trigger a 30% hike.
Mathematical Models and Actuarial Techniques Used in Premium Adjustment
Insurance pricing relies on a blend of traditional actuarial methods and advanced predictive analytics to ensure statistical validity and fairness. Below are the core mathematical frameworks insurers employ, along with their application in score-based adjustments.1. Actuarial Tables and Loss Ratios
Actuarial tables are precomputed matrices that correlate risk factors (e.g., age, score tier) with expected claim costs. For auto insurance, a table might show that drivers aged 25–30 with scores <600 incur average claims of $3,500 annually, while those with scores >750 incur $1,200. The premium is calculated as:
Premium = (Expected Claims + Administrative Costs + Profit Margin) × Safety Loading Factor
For example, if the expected claim for a high-risk scorer is $3,500 and the insurer adds a 20% safety loading, the base premium becomes $4,200 before score adjustments.
2. Generalized Linear Models (GLMs)
GLMs extend traditional regression by accommodating non-normal claim distributions (e.g., skewed data). Insurers use GLMs to model the relationship between insurance scores and claim frequencies, often incorporating a log-link function to predict the natural logarithm of claims:
log(E[Claims]) = β₀ + β₁(Score) + β₂(Age) + ... + ε
Here, β₁ represents the sensitivity of claims to score changes. A β₁ of –0.05 implies a 5% reduction in expected claims for every 10-point increase in score.
3. Machine Learning: Gradient Boosting and Random Forests
Modern insurers leverage ensemble methods like XGBoost or Random Forests to handle high-dimensional data (e.g., combining credit scores, social media activity, and telematics data). These models generate non-linear risk scores by iteratively correcting prediction errors. For instance, a gradient-boosted model might reveal that a 10-point score drop correlates with a 7% increase in property damage claims, even after controlling for other variables.
4. Markov Chains for Dynamic Risk Assessment
For policies with long-term exposure (e.g., life or health insurance), insurers use Markov chains to model how risk scores evolve over time. A policyholder’s score may transition between states (e.g., "Low," "Medium," "High") based on probabilistic rules derived from historical transitions. This allows insurers to price policies considering the expected present value of future claims:
EPV = Σ [P(Stateₜ) × Claim_Cost(Stateₜ) × Discount_Factor]
5. Monte Carlo Simulations for Scenario Testing
To stress-test pricing models, insurers run Monte Carlo simulations with thousands of synthetic policyholder profiles. For example, simulating 10,000 drivers with scores ranging from 500–900 might reveal that 95% of scores >700 result in <$1,500 annual claims, justifying lower premiums. This probabilistic approach reduces reliance on single-point estimates.
Legal and Ethical Considerations in Score-Based Pricing
The use of insurance scores intersects with regulatory frameworks designed to prevent discrimination and ensure transparency. Below are the critical legal and ethical dimensions insurers must navigate, as summarized in regulatory guidelines and case law.Insurance scoring systems must comply with anti-discrimination laws (e.g., the Equal Credit Opportunity Act (ECOA) in the U.S., Article 22 of GDPR in the EU) and fair lending principles (e.g., HM Treasury’s Fair Treatment of Customers in the UK). Key ethical risks include:Regulatory Safeguards and Best Practices:
Proxy Discrimination: Scores derived from credit history or ZIP codes may inadvertently reflect protected characteristics (e.g., race, income level) without direct intent. Algorithmic Bias: Machine learning models trained on historical data may perpetuate biases (e.g., penalizing low-income applicants disproportionately). Lack of Transparency: "Black box" models (e.g., deep learning) obscure how scores influence pricing, violating consumer right-to-explanation principles. Adverse Selection: Over-reliance on scores may exclude high-risk individuals from coverage, creating market inefficiencies or regulatory scrutiny.
Data Sources and Collection Methods for Insurance Scores
Insurance scores are derived from a structured and multi-layered data collection process that integrates internal records, third-party datasets, and real-time behavioral insights. The accuracy and relevance of these scores depend on the diversity and granularity of data inputs, which range from historical claims histories to dynamic telemetry feeds. This section examines the primary data sources leveraged by insurers, the methodological pipeline for processing these inputs, and the emerging role of connected devices in continuously refining risk assessments.The compilation of insurance scores relies on a systematic workflow that transforms raw data into actionable risk classifications. Below is a textual representation of the data collection pipeline:
1. Data Acquisition: Insurers gather data from proprietary databases (e.g., claims records, policyholder profiles) and external vendors (e.g., credit bureaus, motor vehicle reports).
2. Normalization: Collected data undergoes standardization to ensure consistency across disparate sources, addressing variations in formats, units, or reporting conventions.
3. Scoring Algorithm: Normalized data is processed through statistical or machine-learning models to generate a numerical score reflecting risk propensity.
4. Risk Classification: The derived score is mapped to predefined risk tiers, which influence underwriting decisions, premiums, and policy terms.
Primary Data Sources for Insurance Scores
The efficacy of insurance scoring models hinges on the breadth and depth of data inputs, which can be categorized into three broad groups:- Internal Claims Data: Historical loss ratios, frequency of claims, and severity metrics from an insurer’s own portfolio. This data is critical for identifying patterns specific to the insured population.
The integration of these sources enables insurers to construct a holistic view of risk, balancing historical trends with dynamic behaviors.
Data Collection Pipeline: Flowchart Representation
The transformation of raw data into insurance scores follows a linear yet iterative process, outlined below:1. Data Acquisition Phase:
2. Normalization Phase:
3. Scoring Algorithm Phase:
4. Risk Classification Phase:
This pipeline ensures that insurance scores remain adaptive to evolving risk landscapes while maintaining transparency in the underwriting process.
Role of Telematics and IoT in Dynamic Insurance Scoring
The advent of telematics and Internet of Things (IoT) devices has revolutionized insurance scoring by enabling real-time, granular monitoring of risk behaviors. Unlike static scores derived from historical data, these technologies facilitate continuous updates, allowing insurers to adjust premiums and policy terms dynamically.- Telematics in Auto Insurance:
- IoT in Home and Property Insurance:
The integration of telematics and IoT shifts insurance scoring from a periodic assessment to a continuous risk management framework, aligning premiums with real-time exposure.
Data Types, Collection Methods, and Privacy Considerations
The table below summarizes key data types used in insurance scoring, their collection methods, update frequencies, and associated privacy concerns. This framework highlights the trade-offs between data granularity and individual privacy rights.| Data Type | Collection Method | Frequency of Update | Privacy Concerns | |||||||||||||||||||||||||||||||
|---|---|---|---|---|---|---|---|---|---|---|---|---|---|---|---|---|---|---|---|---|---|---|---|---|---|---|---|---|---|---|---|---|---|---|
| Credit History | Third-party credit bureaus (e.g., Experian, TransUnion) | Annual or quarterly (static for most insurers) |
|
|||||||||||||||||||||||||||||||
| Motor Vehicle Records (MVR) | State Department of Motor Vehicles (DMV) databases | Annual or bi-annual (varies by state) |
|
|||||||||||||||||||||||||||||||
| Telematics Data (Auto) | OBD-II ports, smartphone apps, or dedicated devices (e.g., SnapShot by Progressive) | Real-time or daily (continuous for UBI programs) |
|
|||||||||||||||||||||||||||||||
| IoT Sensor Data (Home) | Smart home devices (e.g., Nest, Ring, smart meters) | Real-time or event-triggered (e.g., sensor alerts) |
The Gram-Leach-Bliley Act (GLBA) further restricts sharing of personal insurance score data without consent. Meanwhile, the European Union’s General Data Protection Regulation (GDPR) imposes broader transparency obligations: State-level regulations in the U.S. (e.g., California’s Insurance Information and Privacy Protection Act) may impose additional restrictions on data collection, such as prohibiting scores based on protected classes (e.g., race, gender) or non-risk-related factors (e.g., ZIP code alone). Steps to Request and Review an Insurance ScoreConsumers can obtain their insurance score through structured requests to insurers or credit bureaus, though the process varies by jurisdiction and provider. Below are the key actions to take:For Credit-Based Insurance Scores (U.S.): For Non-Credit Insurance Scores (e.g., telematics, claims history): EU Consumers: Red Flags Indicating Potential Errors in Insurance ScoresInsurance scores may contain inaccuracies due to outdated data, misreporting, or algorithmic biases. Consumers should scrutinize their scores for the following discrepancies and take corrective action:Common sources of errors in insurance scores:Steps to Dispute Inaccuracies: 1. Gather documentation proving the error (e.g., claim closure letters, corrected credit reports, or proof of address updates). 2. Submit a dispute to the insurer in writing (email or certified mail) with: 4. Escalate to regulators if unresolved: Checklist for Improving Insurance ScoresProactive measures can enhance insurance scores by mitigating perceived risk and demonstrating responsible behavior. Below is a structured checklist for consumers to optimize their profiles:Credit-Based Insurance Scores: Claims and Driving History: Telematics and Usage-Based Programs: Demographic and Policy Management: Long-Term Strategies:
Key Differences in Scoring Factors: "Insurance scoring in health care is uniquely constrained by laws like the Affordable Care Act, which prohibit discrimination based on pre-existing conditions, yet still allow risk adjustment through actuarial models." — American Academy of Actuaries, 2023 Comparative Analysis of Scoring FactorsThe following table summarizes the critical scoring factors, score ranges, and their impact on coverage limits for the three insurance types. Score ranges are illustrative, as proprietary algorithms vary by insurer.
Case Study: A Consumer’s Divergent Insurance ScoresA 45-year-old professional with a mixed risk profile demonstrates how scoring varies across insurance types. Their scores are derived from hypothetical but realistic data points:1. Auto Insurance Score: 780/900 2. Homeowners Insurance Score: 620/1,000 3. Health Insurance Score: 85/100 Key Insight: Emerging Trends in Insurance ScoringInsurance scoring is evolving with advancements in AI, big data, and regulatory adaptations. Three trends are reshaping underwriting:1. AI-Driven Dynamic Scoring in Health Insurance Tools and Technologies Behind Insurance Score CalculationsInsurance scoring relies on sophisticated computational frameworks that integrate statistical modeling, machine learning, and large-scale data processing to assess risk with precision. These technologies transform raw, heterogeneous data—such as claims history, demographic details, and behavioral patterns—into actionable risk profiles. The underlying tools range from proprietary enterprise software to open-source libraries, each optimized for scalability, interpretability, and real-time decision-making. Below is an exploration of the technical infrastructure powering insurance score calculations, from algorithmic selection to big data integration.Machine Learning Algorithms in Insurance Score GenerationThe core of insurance scoring lies in machine learning (ML) algorithms that process structured and unstructured data to predict risk likelihood. These algorithms are chosen based on their ability to handle nonlinear relationships, feature importance, and interpretability requirements. Commonly deployed models include:- Decision Trees and Random Forests Example: A random forest model might weigh "past claim frequency" (weight: 0.45) more heavily than "education level" (weight: 0.10) in auto insurance scoring. Key Advantage: GBMs handle mixed data types (numeric, categorical) and missing values, critical for insurance datasets with sparse or incomplete records. - Hybrid Models Predictive Modeling Software and LibrariesThe implementation of insurance scoring algorithms depends on specialized software and libraries, categorized by deployment environment and use case:- Enterprise Software Solutions - Open-Source Libraries Example Workflow in Python (scikit-learn): Feature Selection and Weighting in Insurance ScoringThe accuracy of an insurance score hinges on the selection and weighting of input features, which are derived from both internal and external data sources. The process involves:- Feature Engineering - Feature Importance and Weighting
Big Data Platforms for Real-Time Insurance ScoringThe volume and velocity of insurance data—spanning claims, IoT sensors, and third-party feeds—demand distributed computing frameworks. Key platforms include:- Apache Hadoop - Apache Spark - Data Lakes and Lakehouses Architecture Example (Lambda Architecture): |
Leave a Comment
Comments are moderated before appearing. The data you submit is processed according to the Privacy Policy of viralcontentbee.com.