How to Find Interquartile Range: The Definitive Statistical Method
The interquartile range (IQR) is the statistical measure that quietly underpins some of the most critical decisions in data science, finance, and research. Unlike the mean or median, which can be skewed by outliers, the IQR isolates the middle 50% of a dataset, offering a robust way to assess variability. Whether you’re analyzing market trends, quality control metrics, or academic performance data, knowing how to find interquartile range ensures you’re measuring dispersion without distortion.
Yet, for many practitioners—from students grappling with introductory statistics to professionals refining predictive models—the process of calculating the IQR remains a source of confusion. Missteps here can lead to skewed interpretations, especially when comparing datasets or constructing visualizations like box plots. The IQR isn’t just a formula; it’s a lens through which outliers, skewness, and data consistency become visible. Mastering it means moving beyond surface-level summaries to uncover the true spread of your data.
This guide demystifies the process of determining the IQR, from its theoretical foundations to practical applications. We’ll dissect why it matters, how it’s derived, and how it compares to other statistical tools. By the end, you’ll not only know how to find interquartile range with confidence but also recognize when and why to prioritize it over alternatives.

The Complete Overview of How to Find Interquartile Range
The interquartile range is a cornerstone of descriptive statistics, serving as a measure of statistical dispersion that focuses on the central tendency of a dataset. Unlike the range (which spans the entire dataset from minimum to maximum), the IQR zeroes in on the middle 50% of values, effectively filtering out the influence of extreme observations. This makes it particularly valuable in fields where outliers—such as fraudulent transactions in finance or measurement errors in engineering—can skew traditional metrics like standard deviation.
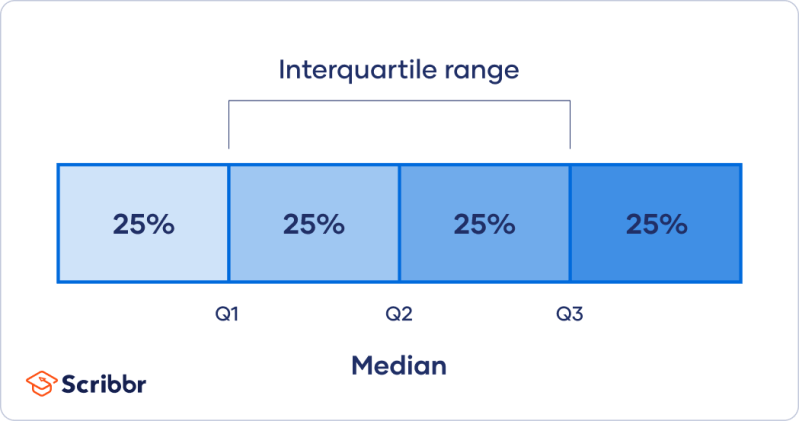
To find interquartile range, you first identify the first quartile (Q1, the 25th percentile) and the third quartile (Q3, the 75th percentile). The IQR is then calculated as Q3 minus Q1. This simple subtraction reveals the breadth of the dataset’s core distribution, providing insights into consistency, variability, and potential anomalies. For instance, in healthcare, a low IQR in patient recovery times might indicate predictable outcomes, while a high IQR could signal underlying issues requiring investigation.
Historical Background and Evolution
The concept of quartiles and the interquartile range traces back to the early 19th century, when statisticians sought ways to summarize large datasets without relying solely on central tendency measures like the mean. Karl Pearson, a pioneer in statistical theory, emphasized the importance of dividing data into quartiles to better understand distribution shapes. His work laid the groundwork for what would become a standard tool in exploratory data analysis.
Table of Contents
- The Complete Overview of How to Find Interquartile Range
- Historical Background and Evolution
- Core Mechanisms: How It Works
- Key Benefits and Crucial Impact
- Major Advantages
- Comparative Analysis
- Future Trends and Innovations
- Conclusion
- Comprehensive FAQs
- Q: What’s the difference between quartiles and the interquartile range?
- Q: Can I calculate the IQR without ordering the data first?
- Q: How does the IQR relate to box plots?
- Q: Is the IQR affected by the dataset’s size?
- Q: When should I use the IQR instead of standard deviation?
- Q: How do I interpret a high IQR?
- Q: Can software calculate the IQR differently?
- Q: What’s the relationship between IQR and the median?
- Q: How is the IQR used in hypothesis testing?
- Q: Are there alternatives to the IQR for measuring spread?
By the mid-20th century, the IQR gained prominence in fields like quality control and economics, where robust measures of dispersion were critical. The rise of computing in the late 20th century further cemented its utility, as algorithms for calculating percentiles became more accessible. Today, the IQR is a staple in software like Python’s `pandas`, R’s `quantile()` function, and even spreadsheet tools, reflecting its enduring relevance in both academic and applied statistics.
Core Mechanisms: How It Works
At its core, how to find interquartile range hinges on partitioning a dataset into four equal parts using quartiles. Q1 (the 25th percentile) and Q3 (the 75th percentile) are the boundaries of the middle 50% of data. The IQR is the distance between these two points, offering a measure of spread that’s resistant to outliers. For example, in a dataset of exam scores, the IQR might reveal that most students scored within a 20-point range, even if a few scored near the extremes.
The calculation itself is straightforward once the quartiles are identified. If your dataset is ordered, Q1 is the median of the first half of the data, and Q3 is the median of the second half. For datasets with an odd number of observations, the median is excluded when splitting the data. This method ensures the IQR accurately reflects the central distribution, regardless of how many extreme values exist at the tails.
Key Benefits and Crucial Impact
The interquartile range is more than a statistical curiosity—it’s a practical tool for decision-making. In finance, traders use it to assess volatility without being derailed by market crashes or bubbles. In manufacturing, engineers rely on it to monitor process consistency, flagging deviations before they escalate into defects. Even in social sciences, researchers employ the IQR to compare income distributions across demographics, where outliers like celebrity earnings could otherwise distort analysis.
What sets the IQR apart is its resilience. While standard deviation amplifies the impact of outliers, the IQR remains stable, making it ideal for datasets with skewed distributions or missing values. This robustness extends to data visualization: in box plots, the IQR forms the "box" that encapsulates the core data, with whiskers and outliers plotted separately. Understanding how to find interquartile range is thus essential for creating accurate, insightful visual representations.
"The interquartile range is the statistician’s shield against the tyranny of outliers. It doesn’t just describe data—it reveals its integrity."
— Dr. John Tukey, Statistician and Data Visualization Pioneer
Major Advantages
- Outlier Resistance: Unlike range or standard deviation, the IQR ignores extreme values, providing a clearer picture of central variability.
- Box Plot Foundation: The IQR defines the boundaries of the box in box-and-whisker plots, aiding in quick visual comparisons across datasets.
- Non-Parametric: No assumptions about data distribution are required, making it versatile for skewed or non-normal data.
- Simplicity: The calculation involves basic quartile identification, accessible even with manual methods or basic software.
- Decision-Making Clarity: In fields like healthcare or quality assurance, a stable IQR helps set realistic benchmarks for performance.

Comparative Analysis
| Metric | Interquartile Range (IQR) | Standard Deviation | Range |
|---|---|---|---|
| Definition | Spread of the middle 50% of data (Q3 - Q1). | Average deviation from the mean. | Difference between max and min values. |
| Outlier Sensitivity | Low (ignores extremes). | High (amplified by outliers). | Very high (defined by extremes). |
| Use Case | Robust dispersion in skewed data. | Normal distributions, parametric tests. | Quick overview of total spread. |
| Calculation Complexity | Moderate (requires quartiles). | High (involves squaring deviations). | Simple (max - min). |
Future Trends and Innovations
As data science evolves, the IQR’s role is expanding beyond traditional statistics. Machine learning models increasingly incorporate robust measures of dispersion to handle noisy or imbalanced datasets. For example, algorithms for anomaly detection often use modified IQR thresholds to identify outliers without false positives. In healthcare, adaptive IQR-based monitoring systems are being developed to predict patient deterioration in real time.
Emerging tools like Python’s `scipy.stats.iqr()` and R’s `Hmisc` package are streamlining calculations, while interactive visualizations (e.g., Shiny apps) allow users to dynamically explore how changes in quartiles affect the IQR. The future may also see hybrid metrics combining IQR with other robust statistics, such as the median absolute deviation (MAD), to further refine data analysis in complex domains.
Conclusion
Understanding how to find interquartile range is not just about crunching numbers—it’s about gaining a deeper, more resilient understanding of your data. Whether you’re a student verifying homework, a data analyst refining models, or a researcher interpreting trends, the IQR offers a reliable way to measure spread without the distortions of outliers. Its historical significance, practical advantages, and adaptability ensure it remains a staple in statistical toolkits.
As you apply these principles, remember that the IQR is just one piece of the puzzle. Pair it with visualizations like box plots, explore complementary metrics, and always consider the context of your data. The goal isn’t just to calculate but to interpret—turning raw numbers into actionable insights.
Comprehensive FAQs
Q: What’s the difference between quartiles and the interquartile range?
A: Quartiles divide data into four equal parts (Q1, Q2/median, Q3), while the IQR specifically measures the distance between Q1 and Q3 (Q3 - Q1). The IQR uses quartiles but focuses on the middle 50% of values.
Q: Can I calculate the IQR without ordering the data first?
A: No. Quartiles (and thus the IQR) require ordered data. Sorting ensures accurate percentile identification, which is critical for correct IQR calculation.
Q: How does the IQR relate to box plots?
A: The IQR defines the "box" in a box plot, with Q1 and Q3 marking its edges. Whiskers typically extend to 1.5×IQR beyond the box, and outliers are plotted beyond the whiskers.
Q: Is the IQR affected by the dataset’s size?
A: Yes, but indirectly. Larger datasets may have more precise quartile estimates, while small datasets can lead to less stable IQR values due to limited data points between quartiles.
Q: When should I use the IQR instead of standard deviation?
A: Use the IQR when your data is skewed, contains outliers, or you’re working with non-normal distributions. Standard deviation is better suited for symmetric, normally distributed data.
Q: How do I interpret a high IQR?
A: A high IQR indicates greater variability in the middle 50% of your data. This could reflect inconsistent processes, diverse populations, or underlying heterogeneity that warrants further investigation.
Q: Can software calculate the IQR differently?
A: Yes. Some methods (e.g., linear interpolation vs. nearest-rank) may yield slightly different quartiles, especially with small datasets. Always clarify the method used (e.g., "method=7" in R’s `quantile()`).
Q: What’s the relationship between IQR and the median?
A: The median (Q2) is the midpoint of the dataset, while the IQR measures the spread around the median. Together, they provide a fuller picture of central tendency and dispersion.
Q: How is the IQR used in hypothesis testing?
A: The IQR isn’t directly used in parametric tests (e.g., t-tests) but is valuable in non-parametric tests like the Wilcoxon rank-sum test, where robust measures of spread are preferred.
Q: Are there alternatives to the IQR for measuring spread?
A: Yes. Alternatives include the median absolute deviation (MAD), range, and standard deviation. The choice depends on data characteristics—e.g., MAD is robust like IQR but scales differently.
Leave a Comment
Comments are moderated before appearing. The data you submit is processed according to the Privacy Policy of Viralcontentbee.