How to Find P-Value: The Definitive Statistical Guide for Researchers
The p-value is the cornerstone of statistical inference, yet its proper calculation remains one of the most misunderstood concepts in modern research. Researchers across disciplines—from medical trials to social sciences—rely on this metric to validate hypotheses, yet misapplication leads to flawed conclusions. Understanding how to find p-value isn’t just about plugging numbers into software; it’s about grasping the probabilistic framework that separates meaningful results from statistical noise.
Many assume p-values are straightforward outputs, but their derivation involves nuanced decisions: choosing the right test (t-test, chi-square, ANOVA), interpreting effect sizes, and accounting for multiple comparisons. Even seasoned analysts often overlook critical steps—like verifying normality assumptions or adjusting for family-wise error rates—which can distort findings. The stakes are high: a miscalculated p-value can invalidate years of research or, worse, mislead policy decisions.
The process begins with a hypothesis—null and alternative—and ends with a probability statement. Yet between these points lies a labyrinth of statistical tests, distribution assumptions, and software quirks. This guide dissects the methodology, from manual calculations to automated tools, ensuring clarity at every step. Whether you’re a student validating a thesis or a professional refining a clinical study, mastering how to find p-value is non-negotiable.

The Complete Overview of How to Find P-Value
At its core, how to find p-value revolves around comparing observed data to a null hypothesis. The p-value quantifies the probability of obtaining results at least as extreme as those observed, assuming the null is true. This probability threshold—typically set at 0.05—determines statistical significance. However, the path to this number varies by test type: parametric tests (e.g., t-tests) rely on normal distributions, while non-parametric alternatives (e.g., Mann-Whitney U) use rank-based methods.The process isn’t static. It demands iterative refinement: selecting the appropriate test (e.g., paired vs. unpaired samples), validating assumptions (e.g., homogeneity of variance), and interpreting software outputs correctly. For instance, a one-tailed p-value differs from two-tailed; omitting this distinction can lead to Type I errors. Even with advanced tools like R or Python, users must understand the underlying mechanics to avoid misconfigurations—such as using the wrong distribution or ignoring effect sizes.
Historical Background and Evolution
The p-value’s origins trace back to early 20th-century statisticians like Ronald Fisher and Jerzy Neyman, who formalized hypothesis testing. Fisher’s p-value was initially a measure of "surprise"—how unlikely an observation was under the null. Neyman and Pearson later introduced decision rules (reject/fail to reject), framing p-values as tools for error control. This evolution reflected a shift from exploratory analysis to confirmatory testing, embedding p-values in rigorous scientific workflows.Yet the concept has faced criticism. In the 1990s, debates emerged over p-value abuse, particularly in medicine and psychology, where researchers were accused of "p-hacking"—manipulating data to achieve significance. Responses included stricter thresholds (e.g., p < 0.005) and alternatives like Bayesian methods. Today, how to find p-value is taught alongside warnings: context matters. A p-value of 0.049 in a well-powered study differs from one in an underpowered trial with questionable assumptions.
Core Mechanisms: How It Works
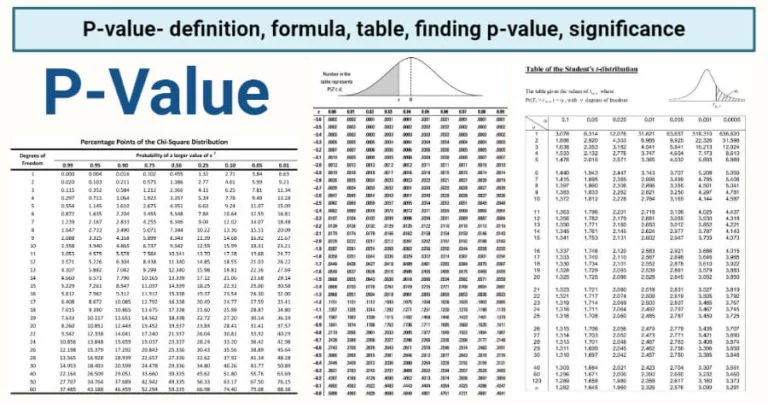
The mechanics hinge on three pillars: the test statistic, the sampling distribution, and the significance level. For example, in a two-sample t-test, the test statistic (t) is calculated from sample means and variances. This statistic is then mapped to a t-distribution, yielding a p-value—the area under the curve beyond the observed t-value. The choice of distribution (t, F, chi-square) depends on the test’s assumptions.Table of Contents
- The Complete Overview of How to Find P-Value
- Historical Background and Evolution
- Core Mechanisms: How It Works
- Key Benefits and Crucial Impact
- Major Advantages
- Comparative Analysis
- Future Trends and Innovations
- Conclusion
- Comprehensive FAQs
- Q: What’s the difference between a one-tailed and two-tailed p-value?
- Q: Can a p-value ever be zero?
- Q: How do I handle multiple comparisons when calculating p-values?
- Q: Why might my p-value be higher than expected despite strong results?
- Q: How does software like R or SPSS calculate p-values internally?
- Q: Is a p-value of 0.05 the only acceptable threshold?
- Q: What’s the relationship between p-values and confidence intervals?
- Q: How do I interpret a p-value in the context of effect size?
- Q: Can I use p-values for non-normal data?
- Q: What’s the difference between p-values and q-values?
Software automates this process, but users must specify critical parameters. In R, `t.test()` requires `var.equal = TRUE/FALSE`; in Python’s `scipy.stats`, `ttest_ind()` demands correct `equal_var` logic. Omitting these inputs can lead to incorrect p-values. Even with automation, manual checks—such as visualizing residuals or running Shapiro-Wilk tests—are essential to confirm assumptions like normality or equal variances.
Key Benefits and Crucial Impact
The p-value’s utility extends beyond academia. In clinical trials, it dictates drug approvals; in economics, it validates policy impacts. Its binary nature (significant/non-significant) simplifies complex data into actionable insights. However, this simplicity masks risks: overreliance on p-values can ignore effect sizes or practical significance. The American Statistical Association’s 2016 statement on p-values underscored this, urging researchers to report confidence intervals and effect sizes alongside p-values.Misinterpretation is rampant. A p-value doesn’t measure the probability that the null is true (that’s a Bayesian concept) or the strength of evidence. It’s a tool, not a truth. Yet in peer-reviewed journals, p-values remain gatekeepers of publishable results. Understanding how to find p-value correctly thus safeguards against replication crises and flawed inferences.
"Statistical significance is not the same as practical significance. A p-value tells you nothing about the size of the effect or its importance." — Nassim Nicholas Taleb, "Antifragile"
Major Advantages
- Objective Decision-Making: P-values provide a standardized metric for hypothesis rejection, reducing subjectivity in research conclusions.
- Reproducibility: When calculated correctly, p-values ensure consistency across studies, provided methodology remains identical.
- Software Integration: Tools like SPSS, R, and Python automate p-value calculation, accelerating analyses for large datasets.
- Regulatory Compliance: Industries like pharmaceuticals and finance mandate p-value reporting for compliance and transparency.
- Educational Clarity: P-values serve as an accessible entry point for non-statisticians to grasp hypothesis testing fundamentals.

Comparative Analysis
| Aspect | Traditional P-Value Approach | Bayesian Alternative |
|---|---|---|
| Interpretation | Probability of data given the null (P(data|H₀)) | Probability of the null given the data (P(H₀|data)) |
| Decision Rule | Reject H₀ if p < α (e.g., 0.05) | Compare posterior odds to prior odds |
| Assumptions | Requires strict distributional assumptions | Relies on prior distributions and likelihood |
| Common Use Cases | Clinical trials, A/B testing, social sciences | Complex models, small samples, exploratory analysis |
Future Trends and Innovations
The p-value’s dominance is being challenged by innovations like Bayesian workflows and machine learning. Tools like Stan and PyMC now offer seamless Bayesian inference, where p-values are supplemented by posterior distributions. Meanwhile, fields like genomics are adopting false discovery rate (FDR) methods to control for multiple testing, reducing reliance on rigid p-value thresholds.Yet traditional methods persist. Regulatory bodies still prioritize p-values for validation, and their simplicity ensures widespread use. The future may lie in hybrid approaches—combining p-values with effect sizes, predictive intervals, and model comparison metrics—to paint a fuller picture of statistical evidence.
Conclusion
Mastering how to find p-value is more than a technical skill; it’s a commitment to rigorous science. From manual calculations to automated pipelines, each step demands precision. The risks of misapplication—false positives, wasted resources, or erroneous conclusions—are too high to ignore. As research evolves, so must our approach to p-values: integrating them with broader statistical frameworks while acknowledging their limitations.For practitioners, the key takeaway is balance. Use p-values as one tool among many, always cross-referencing with effect sizes, confidence intervals, and domain knowledge. The goal isn’t just to find a p-value but to interpret it within the context of the research question—and the real-world implications it carries.
Comprehensive FAQs
Q: What’s the difference between a one-tailed and two-tailed p-value?
A: A one-tailed p-value tests for an effect in a specific direction (e.g., "Drug A > Placebo"), while two-tailed tests for any difference (e.g., "Drug A ≠ Placebo"). One-tailed tests are more powerful but risk Type III errors if the effect direction is wrong. Always align the test with your hypothesis.
Q: Can a p-value ever be zero?
A: Theoretically, no. P-values are continuous probabilities, so they approach zero but never reach it. In practice, software may display "p < 2.2e-16" due to floating-point precision limits. This typically indicates extremely strong evidence against the null.
Q: How do I handle multiple comparisons when calculating p-values?
A: Use correction methods like Bonferroni (divide α by the number of tests), Holm-Bonferroni, or false discovery rate (FDR) controls. For example, with 10 tests at α=0.05, Bonferroni sets each test’s threshold to 0.005. Ignoring corrections inflates Type I error rates.
Q: Why might my p-value be higher than expected despite strong results?
A: Common causes include small sample sizes (low statistical power), violated test assumptions (e.g., non-normality), or incorrect test selection (e.g., using a t-test on non-continuous data). Always check residuals, effect sizes, and alternative tests (e.g., Mann-Whitney for non-normal data).
Q: How does software like R or SPSS calculate p-values internally?
A: Most software uses cumulative distribution functions (CDFs) of the test’s reference distribution (e.g., `pt()` in R for t-tests). For example, `t.test()` computes the CDF of the t-distribution at the observed t-statistic, then doubles it for two-tailed tests. Non-parametric tests (e.g., `wilcox.test()`) use permutation methods.
Q: Is a p-value of 0.05 the only acceptable threshold?
A: No. The 0.05 threshold is conventional but arbitrary. Fields like genomics use stricter cutoffs (e.g., 1e-8) due to multiple testing. Always justify your threshold based on the study’s goals, prior research, and potential consequences of errors.
Q: What’s the relationship between p-values and confidence intervals?
A: A 95% confidence interval (CI) corresponds to a two-tailed p-value of 0.05 if the CI excludes the null value. For example, if a 95% CI for a mean difference is [2, 5], the p-value for H₀: difference=0 is <0.05. CIs provide more information (e.g., effect size, precision) than p-values alone.
Q: How do I interpret a p-value in the context of effect size?
A: A significant p-value (e.g., 0.03) doesn’t imply a meaningful effect. Always report effect sizes (e.g., Cohen’s d, odds ratio) and consider practical significance. For instance, a drug with p=0.04 but a tiny effect size may not justify clinical use.
Q: Can I use p-values for non-normal data?
A: Not directly for parametric tests (e.g., t-tests). For non-normal data, use non-parametric alternatives like the Mann-Whitney U test (independent samples) or Wilcoxon signed-rank test (paired samples). These rank data, making them robust to distribution shape.
Q: What’s the difference between p-values and q-values?
A: P-values assess individual hypothesis tests, while q-values (from FDR methods) control the expected proportion of false positives among all significant results. For example, in a study with 100 tests, 5 significant p-values might yield q-values of 0.01, 0.02, etc., indicating adjusted significance levels.
Leave a Comment
Comments are moderated before appearing. The data you submit is processed according to the Privacy Policy of Viralcontentbee.