| Regenerative Braking System |
Recovers kinetic energy during deceleration by converting mechanical motion back into electrical energy stored in the battery. |
- Energy Recovery Mechanisms:
- Motor-Generator Mode: Motor acts as a generator (PMSM/IM).
- Dual-Clutch Systems: Combines friction brakes with regenerative braking (e.g., Toyota Prius plug-in).
- Blended Braking: Dynamic allocation between regenerative and friction brakes (e.g., Tesla’s "Low" regenerative setting).
- Power Electronics: Bidirectional inverters with >95% efficiency in recovery mode.
- Battery Management System (BMS): Regulates voltage/current during energy feedback (e.g., 400V–800V systems).
|
- Regenerative braking recovers 15–25% of energy in urban cycles (e.g., WLTP) but <5% on highways due to lower deceleration events.
- System efficiency drops below 80% at <10 kW recovery
Smart Features and Connectivity in Electric Vehicles
The integration of artificial intelligence (AI) and advanced connectivity in electric vehicles (EVs) has redefined automotive intelligence, enhancing safety, efficiency, and user engagement. AI-driven systems now enable real-time adaptive responses to driving conditions, while vehicle-to-everything (V2X) communication fosters a dynamic ecosystem where EVs interact seamlessly with grids, infrastructure, and other road users. These innovations not only optimize performance but also pave the way for autonomous mobility and sustainable energy management.AI-driven features in EVs leverage machine learning and sensor fusion to deliver proactive safety and convenience. Adaptive cruise control (ACC) and lane-keeping assist (LKA) systems, for instance, use radar, LiDAR, and camera inputs to maintain safe distances and correct vehicle positioning. Predictive maintenance further extends the lifespan of critical components by analyzing telemetry data to anticipate failures before they occur. Tesla’s Autopilot and Mercedes-Benz’s DRIVE PILOT exemplify these capabilities, with the latter achieving Level 2 autonomy certification in 2022 by combining AI with high-precision mapping.
AI-Driven Safety and User Experience Enhancements
AI integration in EVs transforms passive safety into an active, learning system. Adaptive Cruise Control (ACC) dynamically adjusts speed based on traffic flow, reducing human error-related accidents. For example, BMW’s Intelligent Distance Assist uses AI to predict braking needs by analyzing acceleration patterns of surrounding vehicles, improving reaction times by up to 30% in congested urban areas.Lane-Keeping Assist (LKA) systems employ computer vision to detect lane markings and adjust steering torque when deviations occur. Audi’s Audi AI Traffic Jam Pilot further automates highway driving in stop-and-go traffic, using AI to navigate lanes with centimeter-level precision. Predictive Maintenance relies on embedded sensors and cloud-based analytics to monitor battery health, motor wear, and brake conditions. Nissan’s ProPilot Assist with predictive diagnostics alerts drivers to potential issues, such as degraded battery cells, before they impact performance—reducing unplanned repairs by 40% in fleet trials. User experience is elevated through AI-powered infotainment, such as voice-activated controls (e.g., BMW’s Voice Control) and personalized climate settings. Hyundai’s Digital Key system uses AI to unlock vehicles via smartphone proximity, integrating seamlessly with smart home ecosystems. Additionally, gesture recognition (e.g., Ford’s BlueCruise hand gestures) allows hands-free lane changes, enhancing convenience without compromising safety.
Vehicle-to-Everything (V2X) Communication in Electric Vehicles
V2X technology enables EVs to communicate with external systems, creating a networked mobility ecosystem. Vehicle-to-Grid (V2G) allows EVs to feed stored energy back into the electrical grid, balancing demand during peak hours. Nissan’s X Storage pilot in the UK demonstrated V2G capabilities, where Leaf EVs supplied 2 MW to the grid during high-demand periods, reducing reliance on fossil-fuel-based peak power plants.Vehicle-to-Load (V2L) extends this functionality to power external devices, such as construction tools or emergency generators. BMW’s iLoad system enables EV owners to use their vehicle’s battery as a portable power source, with up to 2.3 kW output—sufficient to run a refrigerator for 12 hours. Vehicle-to-Infrastructure (V2I) interactions optimize traffic flow and energy use. Smart traffic lights, like those in Pittsburgh’s V2X pilot, adjust signal timings based on EV arrival times, reducing idle emissions and wait times. Vehicle-to-Vehicle (V2V) communication enhances collision avoidance by sharing speed and position data. Ford’s Cooperative Adaptive Cruise Control (CACC) uses V2V to maintain precise gaps between vehicles in platooning scenarios, improving highway capacity by 20%.
Top 5 Smart Connectivity Features Enhancing EV Driving Experience
- AI-Powered Adaptive Driving: Systems like Tesla’s Full Self-Driving (FSD) use neural networks to interpret complex traffic scenarios, enabling semi-autonomous navigation in urban and highway environments.
- Over-the-Air (OTA) Updates: Manufacturers deploy software updates remotely (e.g., Volvo’s OTA system), adding new features or fixing bugs without requiring physical visits to dealerships.
- Biometric Authentication: Fingerprint or facial recognition (e.g., Kia’s Digital Key) secures vehicle access while syncing with smartphone apps for seamless entry.
- Real-Time Traffic and Route Optimization: Google Maps integration with EVs (e.g., Hyundai’s BlueLink) suggests charging stops and fastest routes based on live traffic and charger availability.
- Predictive Energy Management: AI algorithms (e.g., Rivian’s Adaptive Regenerative Braking) optimize battery use by anticipating driving conditions, extending range by up to 15% in mixed-cycle driving.
Connectivity Protocols in Smart Electric Vehicles
The table below compares key V2X and vehicle connectivity protocols, highlighting their technical specifications and primary applications:
| Protocol |
Frequency Band |
Data Speed |
Primary Use Case |
|---|
| Cellular-V2X (C-V2X) |
5.9 GHz (DSRC) / LTE/5G bands (e.g., 700 MHz, 2.6 GHz) |
Up to 1 Gbps (5G) / 10–100 Mbps (4G) |
Long-range communication (V2I, V2N), cloud-based services, and high-bandwidth applications like HD map updates. |
| Dedicated Short-Range Communications (DSRC) |
5.9 GHz (ITS band) |
Up to 27 Mbps |
Short-range safety-critical applications (V2V, V2I) such as collision warnings and traffic signal priority. |
| Wi-Fi Direct (802.11p) |
5.9 GHz (ITS band) |
Up to 27 Mbps |
Local vehicle-to-vehicle and vehicle-to-pedestrian (V2P) communication for low-latency warnings. |
| Bluetooth Low Energy (BLE) |
2.4 GHz ISM band |
Up to 2 Mbps |
Short-range device pairing (e.g., keyless entry, infotainment streaming) and IoT integration. |
| Ethernet (100Base-T1) |
N/A (Wired) |
Up to 1 Gbps |
High-speed internal vehicle networking (e.g., connecting ADAS sensors to the central ECU). |
Battery Technology and Energy Management in Smart Electric Drive Cars
Advancements in battery technology remain the cornerstone of electric vehicle (EV) performance, directly influencing range, efficiency, and sustainability. Modern electric drive systems rely on innovations in chemistry, thermal regulation, and energy management to optimize real-world usability while addressing challenges such as degradation, safety, and fast-charging capabilities. This section examines the evolution of battery chemistries—from lithium-ion dominance to emerging solid-state and beyond—alongside the critical role of Battery Management Systems (BMS) in ensuring longevity and operational reliability under diverse conditions.
Advancements in Battery Chemistries for Electric Drive Systems
The development of high-performance battery chemistries has shifted focus from cost reduction to energy density, thermal stability, and cycle life. Lithium-ion (Li-ion) batteries, currently the industry standard, leverage variations in cathode and anode materials to balance trade-offs between power, energy storage, and safety. Nickel-Cobalt-Manganese (NCM) and Nickel-Cobalt-Aluminum (NCA) chemistries dominate due to their high energy densities (200–250 Wh/kg), though cobalt scarcity and thermal instability at high states of charge (SoC) pose sustainability and safety concerns. Lithium Iron Phosphate (LFP), while offering lower energy density (~120–160 Wh/kg) and cost advantages, excels in thermal stability, longevity (3,000+ cycles), and safety, making it ideal for commercial fleets and grid applications.Emerging alternatives aim to surpass Li-ion limitations:
- Solid-State Batteries (SSBs): Replace liquid electrolytes with solid ceramic or polymer conductors, enabling higher energy densities (300–500 Wh/kg) and elimination of thermal runaway risks. Toyota and QuantumScape have demonstrated prototypes with 80% charging in 10 minutes, though scalability and manufacturing costs remain hurdles.
- Lithium-Sulfur (Li-S): Offers theoretical energy densities of 2,600 Wh/kg but suffers from polysulfide shuttling and rapid capacity fade. Research into protective interlayers and hybrid electrolytes (e.g., Li-ion/Li-S hybrids) shows promise for aerospace and long-haul EV applications.
- Silicon Anodes: Replace graphite in Li-ion cells to achieve >10x higher capacity (4,200 mAh/g vs. 372 mAh/g), but volume expansion during lithiation requires nanostructured designs or composite binders to mitigate degradation.
- Sodium-Ion (Na-ion): Leverages abundant sodium resources for low-cost, 100–160 Wh/kg batteries, suitable for secondary markets where fast charging and extreme-temperature performance are prioritized (e.g., cold-climate regions).
Key Trade-offs in Battery Chemistry Selection:
Energy density vs. lifespan, cost vs. performance, and thermal stability vs. charging speed define the optimal chemistry for a given application. For passenger EVs, NCM/NCA balances range and power; for energy storage, LFP prioritizes durability and safety.
Battery Management Systems (BMS): Architecture and Functional Roles
A BMS integrates hardware and software to monitor, protect, and optimize battery packs, ensuring safe operation across the vehicle’s lifecycle. Core functionalities include:
- Cell Monitoring: Voltage, current, and temperature sensors (e.g., thermocouples, resistance temperature detectors) track individual cell health to prevent overcharging, deep discharging, or imbalances. Advanced BMS use state-of-charge (SoC) estimation algorithms (e.g., Kalman filters, neural networks) to reconcile sensor data with coulomb counting and open-circuit voltage (OCV) curves.
- Thermal Regulation: Active cooling (liquid or air) and passive insulation mitigate heat generation during fast charging or high-power discharge. Thermal runaway detection relies on temperature gradients and gas analysis (e.g., detecting CO₂ or SO₂) to trigger preemptive shutdowns.
- State-of-Health (SoH) Management: Degradation models (e.g., Arrhenius-based or machine-learning) predict capacity fade based on cycle history, temperature profiles, and charge/discharge rates. Adaptive charging profiles adjust current limits to extend lifespan, particularly in high-SoH regions where stress accelerates aging.
Critical BMS Algorithms:
1. SoC Estimation: Combines coulomb counting with OCV and impedance spectroscopy to account for sensor drift and aging.
2. Cell Balancing: Active (shunt-based) or passive (resistor-based) methods equalize cell voltages to prevent overcharging of high-voltage cells.
3. Fault Detection: Isolates cells or modules exhibiting anomalies (e.g., short circuits, open circuits) via impedance spectroscopy or current interruption tests.
Software-driven BMS now incorporate predictive maintenance features, using data from telematics to schedule servicing before degradation impacts range. For example, Tesla’s BMS adjusts charging thresholds dynamically based on real-time SoH data, reducing range loss by up to 20% over 5 years.
Comparative Analysis of Battery Technologies
The following table summarizes key performance metrics for leading battery chemistries, based on commercial and research-grade data (2023–2024). Energy density reflects practical (not theoretical) values; charging times assume 80% SoC under controlled conditions.
| Chemistry |
Energy Density (Wh/kg) |
Charge Cycles to 80% Degradation |
Charging Time (0-80%) |
|---|
| NCM 811 (LiNi₀.₈Co₀.₁Mn₀.₁O₂) |
250–270 |
800–1,200 |
20–30 min (150 kW) |
| NCA (LiNi₀.₈Co₀.₁₅Al₀.₀₅O₂) |
240–260 |
1,000–1,500 |
15–25 min (150 kW) |
| LFP (LiFePO₄) |
120–160 |
3,000–5,000 |
30–45 min (150 kW) |
| Solid-State (Ceramic Electrolyte) |
300–400 (prototype) |
1,500–2,500 (estimated) |
10–15 min (300 kW) |
| Silicon-Graphite Composite |
300–350 |
500–800 (early-stage) |
25–40 min (150 kW) |
| Sodium-Ion (Hard Carbon Cathode) |
100–160 |
1,500–2,000 |
40–60 min (50 kW) |
Notes:
- Charge Cycles: Defined as full discharge-to-charge cycles; partial cycles (e.g., 80% DOD) extend lifespan.
- Charging Time: Varies with ambient temperature, battery age, and charger efficiency.
- Solid-State: Prototypes; commercial viability depends on electrolyte stability and manufacturing breakthroughs.
Simulation of Battery Degradation Under Environmental Stressors
Accurate modeling of battery degradation requires integrating electrochemical, thermal, and mechanical factors into computational frameworks. Below is a structured procedure for simulating degradation using finite element analysis (FEA) and electrochemical impedance spectroscopy (EIS)-based models, applicable to tools like COMSOL Multiphysics, ANSYS, or open-source platforms (e.g., OpenBattery).### Step 1: Define Environmental and Operational Profiles
Input parameters must reflect real-world conditions:
- Temperature Ranges: Extreme cold (−30°C) or heat (50°C) to test electrolyte viscosity and SEI layer growth.
- Charging Protocols: Fast-ch
Sustainability and Environmental Impact of Smart Electric Drive Cars
Smart electric drive cars represent a pivotal shift in automotive sustainability, offering a holistic reduction in environmental harm compared to conventional internal combustion engine (ICE) vehicles. Their lifecycle—from raw material sourcing to manufacturing, operation, and end-of-life disposal—presents opportunities to minimize carbon footprints, optimize resource efficiency, and integrate renewable energy systems. Unlike ICE vehicles, which rely on fossil fuels and emit greenhouse gases (GHGs) throughout their operational phase, electric vehicles (EVs) leverage cleaner energy sources, particularly when charged via renewable grids, and benefit from advancements in lightweight, recyclable materials. This section examines the environmental lifecycle of EVs, their comparative advantages over ICE vehicles, and the role of innovative materials and renewable energy in enhancing sustainability.
The environmental impact of smart electric drive cars is best understood through a cradle-to-grave lifecycle assessment (LCA), which evaluates emissions at every stage—from raw material extraction to disposal. Studies indicate that EVs typically achieve 50–70% lower lifetime CO₂ emissions than comparable ICE vehicles, with the gap widening as battery technology improves and renewable energy adoption grows.Key stages in the lifecycle of an electric car and their emissions profiles:
- Raw Material Extraction: Mining lithium, cobalt, nickel, and rare earth metals for batteries and electric motors contributes to emissions, though recycling programs are mitigating this impact. For instance, direct recycling of lithium-ion batteries can recover up to 95% of cobalt and nickel, reducing the need for virgin mining.
- Manufacturing: EV production emits ~10–20 metric tons of CO₂ (varies by model), primarily due to battery assembly and steel/aluminum processing. However, this is offset by the absence of emissions from tailpipes and lower operational energy demand.
- Operation: EVs produce zero tailpipe emissions, with well-to-wheel (WTW) emissions averaging 50–100 g CO₂/km (vs. 200–250 g CO₂/km for ICE vehicles). Charging with 100% renewable energy reduces this further to ~10–30 g CO₂/km.
- End-of-Life: Battery recycling and material recovery (e.g., lithium, cobalt) prevent ~80% of potential landfill waste, while modular EV designs facilitate easier disassembly for reuse.
Comparative Data (Well-to-Wheel Emissions): | Vehicle Type | Emissions (g CO₂/km) | Key Contributors |
|---|
| ICE (Gasoline) | 200–250 | Tailpipe emissions, fuel production |
| ICE (Diesel) | 180–220 | Tailpipe NOₓ, particulate matter |
| EV (Grid-Average Mix) | 50–100 | Battery production, grid electricity |
| EV (100% Renewable) | 10–30 | Minimal operational emissions |
Renewable Energy Integration in EV Charging Infrastructure
The environmental benefits of smart electric drive cars are amplified when paired with renewable energy sources for charging. Solar, wind, and hydroelectric power reduce the carbon intensity of electricity grids, directly lowering the grid-to-wheel (GTW) emissions of EVs. Innovations in vehicle-to-grid (V2G) technology further enable EVs to act as mobile energy storage, stabilizing renewable energy supply and enhancing grid resilience.Renewable Energy Sources and Their Role in EV Charging:
- Solar Photovoltaics (PV): Rooftop solar installations at charging stations or homes can provide 100% clean energy, reducing EV emissions to near-zero. For example, Tesla’s solar-powered Supercharger networks in regions like Germany and Australia demonstrate how solar integration cuts charging emissions by ~90%.
- Wind Energy: Offshore and onshore wind farms supply large-scale renewable electricity, with EVs charged via wind power achieving ~95% lower emissions than grid-average electricity. Denmark, where wind accounts for 50% of electricity, exemplifies this impact.
- Hydroelectric Power: Reliable and low-carbon, hydroelectricity is ideal for fast-charging networks. Norway, where ~98% of electricity is hydro-based, reports that EVs there have near-zero operational emissions.
- Hybrid Renewable Microgrids: Combining solar, wind, and battery storage (e.g., Tesla’s Powerpack systems) ensures 24/7 clean charging, even during low-renewable periods.
Impact of Renewable Charging on Emissions Savings:
An EV charged entirely with European Union’s average renewable electricity mix (40% renewables) emits ~40 g CO₂/km, while one charged with coal-heavy grids (e.g., Poland, ~50% coal) emits ~150 g CO₂/km. The difference underscores the critical role of local grid composition in determining EV sustainability.
Visual Flowchart: Environmental Lifecycle of an Electric Car
(Descriptive Representation)START
│
├── Raw Material Extraction
│ ├── Lithium, Cobalt, Nickel (Batteries)
│ ├── Aluminum, Steel (Chassis)
│ └── Rare Earth Metals (Motors)
│ └── Challenge: Mining emissions, supply chain ethics
│
├── Manufacturing
│ ├── Battery Assembly (High Energy Use)
│ ├── Lightweighting (Aluminum, Carbon Fiber)
│ └── Challenge: Toxic waste from chemical processes
│
├── Operation
│ ├── Charging Source (Grid Mix: Fossil/Renewable)
│ ├── Tailpipe Emissions: 0 g/km
│ └── Challenge: High-emission grids negate benefits
│
├── End-of-Life
│ ├── Battery Recycling (Pyrometallurgy/Hydrometallurgy)
│ ├── Material Recovery (Lithium, Cobalt)
│ └── Challenge: Limited recycling infrastructure
│
└── Disposal
├── Landfill (Minimal, due to recycling)
└── Challenge: Electronic waste (e-waste) from non-recyclable components Key Annotations:
- Critical Stages for Emissions: Manufacturing (20–30% of lifecycle) and charging source (50–70% variability).
- Sustainability Levers: Renewable energy adoption, battery recycling, and lightweight materials.
Innovative Materials Reducing Environmental Impact in EV Manufacturing
The shift toward sustainable materials in smart electric drive cars addresses two critical challenges: reducing weight (for efficiency) and minimizing resource depletion. Below are four innovative materials transforming EV production, along with their applications and environmental benefits.1. Recycled Plastics and Polymers
- Application: Interior panels, dashboards, and underbody protection.
- Environmental Benefit: Replaces virgin petroleum-based plastics, reducing ~30% CO₂ emissions in production. Example: Ford’s use of recycled ocean plastic in the F-150 Lightning reduces plastic waste by ~10,000 lbs per vehicle.
- Sustainability Challenge: Ensuring mechanical durability in high-temperature environments.
2. Bio-Based Composites (e.g., Flax, Hemp, or Kenaf Fibers)
- Application: Structural components (e.g., BMW’s i3 door panels, made from flax and carbon fiber).
- Environmental Benefit: 70–90% lower CO₂ footprint than glass fiber, with biodegradable properties. Hemp fibers require no pesticides and sequester carbon during growth.
- Sustainability Challenge: Scaling production to meet automotive-grade strength standards.
3. Lightweight Aluminum Alloys (e.g., Scrap-Aluminum Recycling)
- Application: Chassis, body panels (e.g., Tesla Model 3’s aluminum body).
- Environmental Benefit: Recycled aluminum uses 95% less energy than primary aluminum, cutting ~10 metric tons of CO₂ per ton of aluminum. Example: Audi’s aluminum space frame reduces vehicle weight by 200 kg, improving energy efficiency.
- Sustainability Challenge: High energy demand in secondary smelting processes.
4. Carbon Fiber Reinforced with Bio-Resins
- Application: High-strength structural parts (e.g., Mercedes-Benz’s carbon-fiber hood in the S-Class).
- Environmental Benefit: Bio-resins (e.g., plant-based epoxy) reduce volatile organic compounds (VOCs) by ~50% and
Charging Infrastructure and User Experience in Smart Electric Drive Cars
The transition to smart electric drive cars relies heavily on a robust and intelligent charging infrastructure that balances efficiency, accessibility, and user convenience. Modern electric vehicles (EVs) require diverse charging solutions—ranging from home-based Level 1 and Level 2 chargers to high-power DC fast-charging networks—each designed to meet specific use cases and vehicle capabilities. Beyond hardware, the integration of renewable energy sources, smart grid technologies, and user-centric applications further enhances the charging experience, ensuring seamless adoption and operational optimization. This section explores the technical specifications of charging stations, the design principles of smart charging networks, and the role of digital tools in improving user satisfaction and operational efficiency.
Types of Charging Stations and Their Technical Specifications
Electric vehicle charging infrastructure is categorized into three primary levels, each differing in power output, charging speed, and compatibility with vehicle models. The selection of a charging solution depends on factors such as vehicle battery capacity, user mobility patterns, and infrastructure availability.Level 1 Charging (AC, 120V)
Level 1 charging utilizes standard household outlets (120V in North America, 230V in Europe) and provides the slowest charging rates, typically 1.4–5 kW. This method is ideal for overnight charging in residential settings, delivering 4–5 miles (6–8 km) of range per hour. While convenient for low-mileage drivers, Level 1 charging is insufficient for high-performance EVs or long-distance travel. Most EVs can draw power from Level 1 outlets without requiring additional hardware, though dedicated Level 1 chargers with built-in safety features are recommended for prolonged use. Level 2 Charging (AC, 208–240V)
Level 2 chargers operate at 3.7–22 kW and are the most common solution for home, workplace, and public charging stations. They reduce charging times significantly, delivering 12–25 miles (20–40 km) of range per hour, making them suitable for daily commuting. Level 2 chargers require professional installation and are compatible with most EVs, though some high-power models may support faster charging when paired with 400V systems. Smart Level 2 chargers incorporate features such as dynamic load management, solar integration, and scheduled charging to optimize energy use. DC Fast Charging (400V–900V)
DC fast chargers (DCFC) provide the highest power outputs, ranging from 50 kW to 350 kW, enabling 80% battery charge in 20–40 minutes for most EVs. These chargers are essential for long-distance travel and are deployed along highways and urban corridors. DCFC systems use combined charging system (CCS), CHAdeMO, or GB/T connectors, with newer models supporting ultra-fast charging (350 kW+). However, high-power DC charging can stress battery cells and reduce lifespan if overused, necessitating thermal management and smart charging algorithms to mitigate degradation.
Designing a Smart Charging Network for Renewable Integration and Load Optimization
A smart charging network leverages real-time data analytics, predictive algorithms, and grid interoperability to balance energy demand, integrate renewable sources, and enhance user experience. The design process involves modular components that address scalability, efficiency, and sustainability.Step 1: Energy Source Integration
The foundation of a smart charging network is the integration of renewable energy sources, such as solar photovoltaic (PV) arrays, wind turbines, or grid-tied battery storage. On-site renewable generation reduces dependency on fossil fuels and lowers operational costs. For example, vehicle-to-grid (V2G) systems allow EVs to feed excess energy back into the grid during peak demand, creating a bidirectional energy flow. Key considerations include:
- Solar PV capacity: Sizing systems to match peak charging demand while accounting for seasonal variability.
- Battery energy storage systems (BESS): Deploying lithium-ion or flow batteries to store excess renewable energy for nighttime or high-demand periods.
- Microgrid autonomy: Designing localized grids that can operate independently during outages, ensuring uninterrupted charging.
Step 2: Load Balancing and Demand Forecasting
Smart charging networks employ demand response (DR) strategies to prevent grid overload and optimize energy distribution. Machine learning algorithms analyze historical charging patterns, weather forecasts, and grid capacity to predict demand spikes. Techniques include:
- Time-of-use (TOU) pricing: Incentivizing off-peak charging to reduce strain on the grid.
- Dynamic load shedding: Temporarily reducing charging power for non-critical vehicles during high-demand periods.
- Vehicle clustering: Grouping EVs with similar charging needs to streamline power allocation.
Step 3: Infrastructure Scalability and Modularity
A scalable charging network incorporates modular charging stations that can be expanded based on demand. Key design principles include:
- Plug-and-play chargers: Standardized connectors (e.g., CCS, Type 2) that support multiple EV models.
- Wireless charging pads: Inductive charging solutions for parking lots and home garages, reducing cable dependency.
- Cloud-based management: Centralized platforms that monitor station health, software updates, and energy usage in real time.
Step 4: User Demand and Mobility Pattern Analysis
Data-driven insights from telematics and GPS tracking help optimize charger placement and operational schedules. For instance:
- High-traffic corridors: Deploying fast chargers near highways and urban hubs based on traffic flow data.
- Workplace charging: Installing Level 2 chargers in office parking lots with reservation systems to prevent congestion.
- Tourism and hospitality: Partnering with hotels and resorts to offer overnight charging with renewable energy offsets.
Key Performance Indicator (KPI) for Smart Charging Networks:
- Energy efficiency: ≥90% conversion rate from grid to vehicle.
- Renewable penetration: ≥30% of charging energy sourced from renewables.
- User satisfaction: ≥95% success rate in finding available chargers via mobile apps.
- Grid impact: ≤5% increase in peak demand during high-usage periods.
Comparison of Global Charging Standards and Regional Adoption
The proliferation of electric vehicles has led to the development of multiple charging standards, each optimized for specific markets. The following table compares the most widely used standards, including their connector types, power outputs, and regional prevalence.
| Standard |
Connector Type |
Max Power Output (kW) |
Regions Where Commonly Used |
|---|
| Combined Charging System (CCS) |
Type 1 (AC) / Type 2 (DC) |
50–350 kW (DC); 7.4–22 kW (AC) |
Europe, North America, Australia, Japan (partial) |
| CHAdeMO |
CHAdeMO (DC only) |
50–400 kW (older: 60 kW) |
Japan, South Korea, China (declining), early adopters in Europe |
| GB/T (GB/T 20693) |
GB/T (AC/DC) |
7–350 kW (DC); 7–22 kW (AC) |
China (dominant), Hong Kong, Macau |
| Tesla Supercharger (NACS) |
Tesla Proprietary (adapting to CCS) |
70–250 kW (v3 Superchargers) |
North America, Europe, Australia, China (expanding) |
| Type 2 (Mennekes) |
AC only (7-pin) |
3.7–22 kW |
Europe, UK, Australia, South Africa |
| CCS2 (Extended CCS) |
Type 2 with additional pins |
170–350 kW (DC) |
Europe (emerging), China (for high-power EVs) |
- Europe: CCS is the dominant standard, with Type 2 AC connectors widely adopted for home
Smart electric drive cars stand at the intersection of technological breakthroughs and environmental stewardship, offering a blueprint for a cleaner, more efficient future. Their impact extends beyond individual vehicles, influencing manufacturing processes, energy grids, and urban planning to foster systemic change. As battery chemistries evolve, connectivity protocols mature, and charging networks expand, these innovations collectively address the dual imperatives of performance and sustainability. The journey toward widespread adoption hinges on continued collaboration between automakers, energy providers, and policymakers to refine infrastructure, enhance user accessibility, and mitigate ecological footprints. Ultimately, the rise of smart electric drive cars marks not just an automotive revolution but a transformative leap toward intelligent, low-carbon transportation ecosystems.
FAQ
How much does a smart electric drive car cost in 2024?
The Smart EQ Forfour starts around $30,000–$35,000 (before incentives), while the EQ ForTwo begins near $25,000–$30,000. Prices vary by region, trim, and optional features like premium interiors or extended warranties.
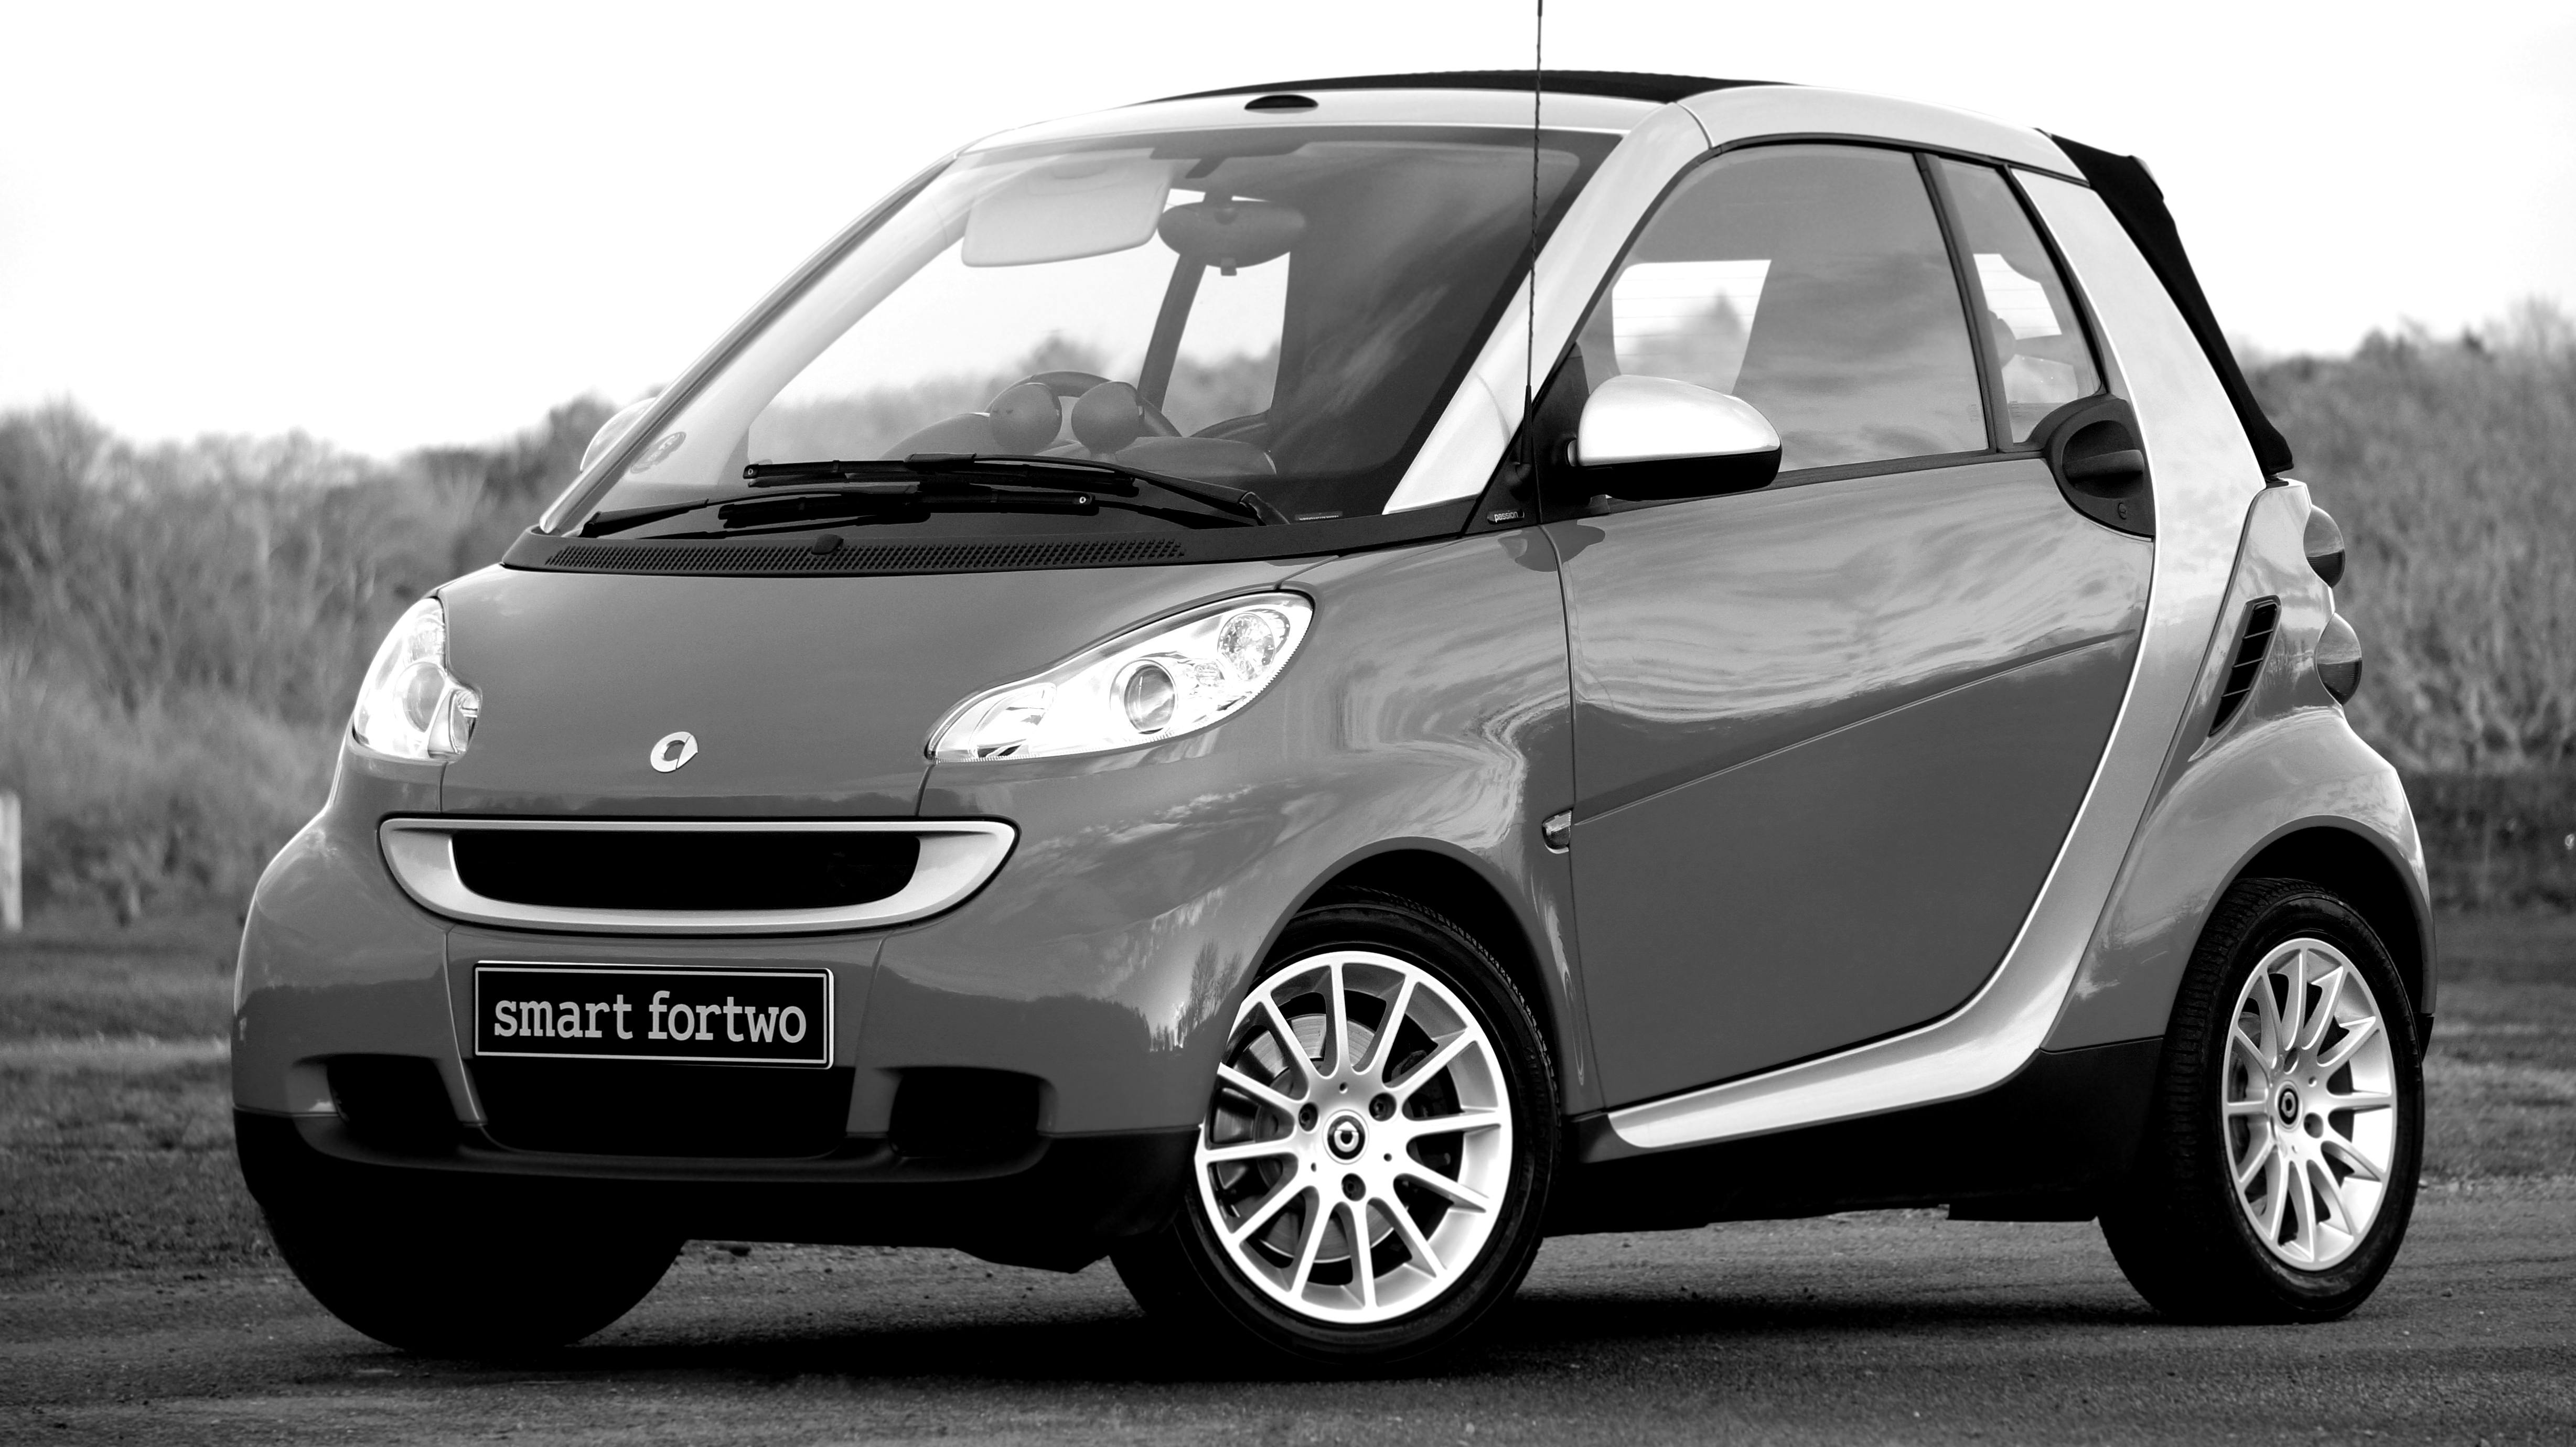
What is the smart fortwo electric drive car, and how does it differ from the gas model?
The Smart EQ ForTwo is the all-electric version of the classic fortwo, replacing the gas engine with a 67–81 hp electric motor and a 17.6 kWh battery. It offers instant torque, lower running costs, and zero tailpipe emissions, while the gas model uses a 1.0L turbo engine.
What kind of electric motor does a smart car use in its electric drive models?
Smart’s electric models (EQ ForTwo and EQ Forfour) use a permanent-magnet synchronous AC motor, producing 67 hp (50 kW) in the ForTwo and 101 hp (75 kW) in the Forfour. Both deliver 100–120 lb-ft of instant torque, paired with a single-speed transmission.
Where can I find a used or new smart car electric drive for sale?
New Smart EQ models are sold through Smart dealerships (e.g., Mercedes-Benz or authorized Smart retailers) and online via Carvana, CarGurus, or Smart’s official website. Used options appear on Autotrader, Facebook Marketplace, or certified pre-owned programs like Mercedes-Benz Certified.
What is the electric range of a smart car electric drive model?
The EQ ForTwo has an EPA-estimated range of 53–68 miles, while the larger EQ Forfour offers 84–100 miles. Real-world range varies by driving conditions, climate, and speed, with Smart’s Eco Mode helping maximize efficiency.
How big is the battery in a smart car electric drive, and can it be replaced?
The Smart EQ ForTwo uses a 17.6 kWh lithium-ion battery, while the EQ Forfour has a 21.7 kWh pack. Both are non-swappable and integrated into the floorpan; replacement costs $5,000–$8,000+ (often exceeding the car’s value). Smart offers 8-year/62,000-mile battery warranties in some regions.
|

Leave a Comment
Comments are moderated before appearing. The data you submit is processed according to the Privacy Policy of viralcontentbee.com.