Comprehensive Guide to Crafting Insurance Reports
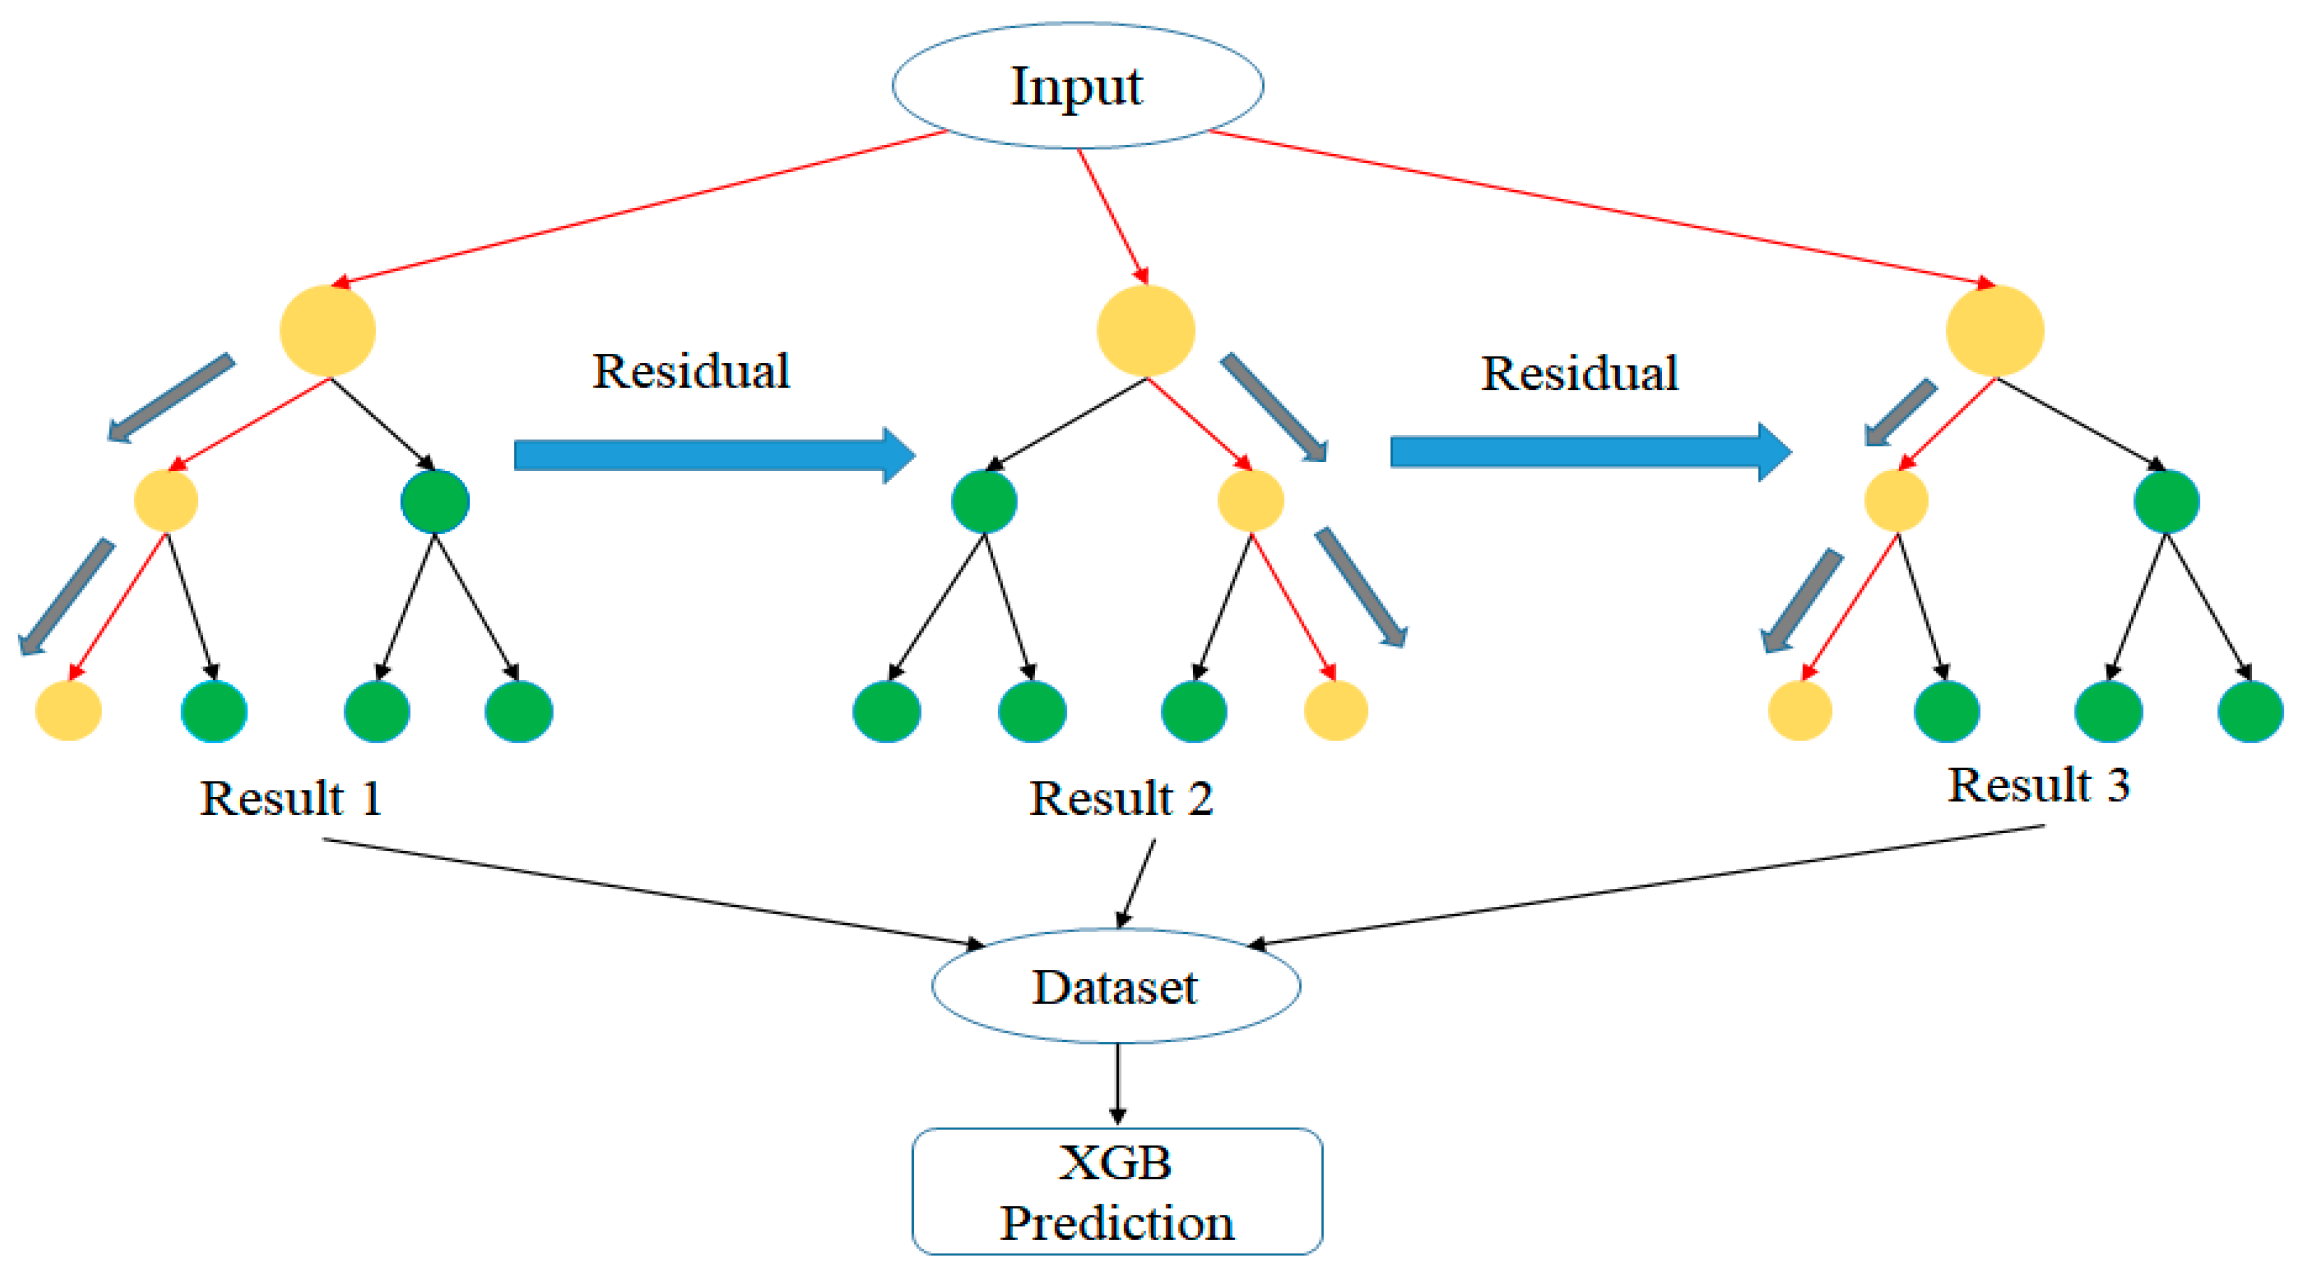
Table of Contents
- Definition and Core Components of an Insurance Report
- Fundamental Elements of an Insurance Report
- Key Sections of an Insurance Report and Their Formatting
- Data Collection Methods for Insurance Reports
- Primary Sources of Data in Insurance Reports
- Procedural Steps for Gathering Evidence in Fraud Investigations
- Risk Assessment Frameworks in Insurance Reporting
- Hierarchical Risk Assessment Framework for Property Insurance Claims
- Methodology for Calculating Risk Exposure Scores
- Predictive Analytics in Insurance Reporting
- Regulatory and Compliance Requirements in Insurance Reporting
- Legal and Regulatory Standards for Insurance Reports
- Ensuring Confidentiality in Sensitive Insurance Reports
- Case Studies and Real-World Applications in Insurance Reporting
- Analysis of a High-Profile Insurance Fraud Case: Timeline of Critical Events
- Structured Hurricane Damage Claim Report: Photographic Evidence and Adjuster Notes
- Geospatial Data Validation in Auto Insurance Reports: Step-by-Step Procedure
Insurance reports serve as the backbone of risk management, claim processing, and regulatory compliance, bridging gaps between policyholders, insurers, and legal frameworks. Their accuracy directly influences financial settlements, fraud detection, and operational efficiency, making them indispensable tools in the insurance industry. This guide dissects the structural, procedural, and analytical dimensions of insurance reporting, from defining core components to leveraging predictive analytics and navigating global compliance standards.
The effectiveness of an insurance report hinges on meticulous data collection, clear documentation of loss assessments, and adherence to evolving regulatory demands. Whether addressing property damage, fraud investigations, or cybersecurity breaches, the report’s integrity determines its impact on claims resolution and stakeholder trust. By integrating standardized templates, risk assessment frameworks, and real-world case studies, this resource equips professionals with the knowledge to produce precise, defensible, and legally sound documentation.
Definition and Core Components of an Insurance Report
An insurance report serves as a formal document that records critical details related to insurance policies, claims, or audits. It ensures transparency, compliance, and accurate decision-making for insurers, policyholders, and regulatory bodies. The structure of an insurance report varies depending on its purpose—whether it is for claims processing, risk assessment, or regulatory audits—but all reports must adhere to standardized components to maintain credibility and legal validity.The core elements of an insurance report are designed to capture essential information systematically. Below is a structured breakdown of these components, their purposes, and illustrative examples to guide consistent documentation.
Fundamental Elements of an Insurance Report
Insurance reports must include specific elements to ensure completeness, accuracy, and compliance with industry standards. The following table outlines the Element Name, its Purpose, and an Example Format for clarity.| Element Name | Purpose | Example Format |
|---|---|---|
| Report Header | Identifies the report type, issuer, and recipient for clarity and traceability. | INSURANCE CLAIM REPORT |
| Policyholder Details | Verifies the identity and contact information of the insured party to confirm eligibility. | Policyholder Name: John Doe |
| Policy Summary | Provides a snapshot of the insurance coverage, including policy type, term, and key exclusions. | Policy Type: Homeowners Insurance |
| Incident/Claim Details | Documents the event triggering the report, including date, time, location, and description. | Incident Date: 15/10/2023 |
| Loss Assessment | Quantifies damages, costs, and supporting evidence to determine claim validity and payout. | Estimated Repair Cost: $12,500 (Flooring: $8,000, Furniture: $4,500) |
| Witness Statements | Provides third-party accounts to corroborate the incident details and reduce disputes. | Witness Name: Jane Smith |
| Insurer’s Findings | Outlines the insurer’s evaluation of the claim, including approval, denial, or partial settlement. | Claim Status: Approved (Partial) |
| Attachments | Lists all supplementary documents referenced in the report for verification. | Attachment 1: Photographs of damaged property (5 files) |
| Signatures and Certifications | Authenticates the report’s validity through authorized signatories. | Signed by: [Policyholder Name] |
Key Sections of an Insurance Report and Their Formatting
Each section of an insurance report serves a distinct purpose and must be formatted to ensure clarity and legal defensibility. Below is a numbered breakdown of the mandatory sections, their structure, and formatting instructions.An insurance report typically follows a logical flow from identification to resolution. The sections are prioritized based on their role in claim processing or audit verification. Mandatory sections are marked with `
` to emphasize their non-negotiable inclusion.2. Policyholder and Policy Information1. Report Identification
This section establishes the report’s purpose and context. It must include:
Report title (e.g., Claim Report, Audit Report). Issuer and recipient details. Unique reference number for tracking. Mandatory: Report title, issuer name, policy number, date, and reference ID.
Accurate identification of the insured and policy terms is critical to avoid misalignment. Include:
Optional: Beneficiary details (if applicable). 3. Incident Description
A detailed account of the event ensures transparency. Structure this section as:
Optional: Video/audio recordings (if available). 4. Damage/Loss Assessment
Quantifiable evidence supports claim validity. Format this section to include:
Optional: Depreciation adjustments for older items. 5. Witness and Third-Party Statements
Corroborating evidence strengthens the report’s credibility. Include:
Optional: Contact details of witnesses. 6. Insurer’s Evaluation and Decision
This
Data Collection Methods for Insurance Reports
Insurance reports rely on structured and verifiable data to ensure accuracy, compliance, and fairness in claims processing, fraud detection, and risk assessment. Effective data collection methods determine the reliability of findings, directly impacting decision-making for insurers, regulators, and stakeholders. This section examines the primary sources of data, procedural steps for evidence gathering—particularly in fraud investigations—and comparative analyses of traditional versus digital collection techniques.Primary Sources of Data in Insurance Reports
Data collection in insurance reports originates from diverse sources, each serving distinct purposes such as claim validation, risk assessment, or compliance verification. Below is a categorized table outlining key sources, the data they provide, and their validation processes.| Source Type | Data Collected | Validation Process |
|---|---|---|
| Policy Documents |
|
|
| Third-Party Assessments |
|
|
| Digital Records |
|
|
| Claimant/Insured Statements |
|
|
| Internal Insurer Systems |
|
|
Procedural Steps for Gathering Evidence in Fraud Investigations
Fraud investigations in insurance require meticulous documentation to withstand legal scrutiny and internal audits. The following steps outline a standardized approach, emphasizing chain-of-custody protocols and admissible evidence standards.Fraud investigations typically follow a phased methodology to ensure thoroughness while maintaining procedural integrity. The process begins with initial suspicion triggers (e.g., red flags in claims data) and progresses through evidence collection, analysis, and reporting. Documentation at each stage must comply with legal admissibility standards (e.g., Frye Standard or Daubert Criteria in U.S. courts) and internal policies to prevent challenges in litigation.
-
Step 1: Trigger Identification and Case Initiation
- Flag suspicious claims using automated tools (e.g., Benford’s Law for numerical anomalies, AI-driven pattern recognition).
- Assign a case number and designate a lead investigator with clearance.
- Obtain approval from compliance/legal teams to proceed.
Example Red Flags:
- Claims filed shortly after policy purchase ("fronting").
- Inconsistent timelines between incident reports and medical treatment.
- Multiple claims from the same location/individual.
-
Step 2: Evidence Preservation
- Secure all original documents (e.g., medical records, repair invoices) in a controlled environment (locked cabinets, encrypted digital storage).
- Create read-only copies for analysis to prevent tampering.
- Document the chain of custody (who handled the evidence, when, and why) in a log.
- Use witness tamper-evident seals for physical evidence (e.g., damaged property).
-
Step 3: Data Collection and Cross-Referencing
- Gather primary evidence:
- Policy documents and payment records.
- Photographs/videos of damage (with geotags and timestamps).
- Medical bills and treatment notes (with patient consent).
- Financial records (bank statements, credit reports).
- Cross-reference with secondary sources:
- Third-party databases (e.g., LexisNexis, Equifax).
- Public records (courthouse filings, DMV reports).
- Social media activity (with legal authorization).
- Employ forensic analysis for digital evidence (e.g., metadata extraction from images, email headers).
- Gather primary evidence:
-
Step 4: Witness and

Risk Assessment Frameworks in Insurance Reporting
Risk assessment frameworks in property insurance serve as structured methodologies to quantify, categorize, and mitigate potential financial losses arising from claims. These frameworks integrate qualitative and quantitative analyses to evaluate exposure to risks such as natural disasters, theft, and human error, enabling insurers to optimize underwriting, pricing, and claims management strategies. The effectiveness of such frameworks relies on a systematic classification of risk categories, empirical data-driven calculations, and the integration of predictive analytics to anticipate future trends.The following sections outline a hierarchical risk assessment framework for property insurance claims, methodologies for calculating risk exposure scores, and the application of predictive analytics in insurance reporting.
Hierarchical Risk Assessment Framework for Property Insurance Claims
A nested risk assessment framework categorizes property insurance risks into three primary layers: external risks (environmental and societal factors), operational risks (process-related vulnerabilities), and internal risks (human and systemic errors). Each layer is further subdivided into specific risk categories, with subcategories detailing granular risk factors. Below is a structured breakdown:
-
External Risks (Environmental and Societal Factors)
-
Natural Disasters
- Climate-related events (floods, hurricanes, wildfires)
- Geological hazards (earthquakes, volcanic activity)
- Atmospheric phenomena (hailstorms, tornadoes)
-
Societal and Political Risks
- Civil unrest or riots
- Regulatory changes impacting coverage or premiums
- Supply chain disruptions (e.g., pandemics, trade wars)
-
Natural Disasters
-
Operational Risks (Process-Related Vulnerabilities)
-
Theft and Vandalism
- Burglary or robbery
- Arson or malicious damage
- Cyber-theft (digital asset breaches)
-
Equipment and Maintenance Failures
- Mechanical breakdowns (HVAC, electrical systems)
- Faulty construction or material defects
- Utility failures (power outages, water leaks)
-
Theft and Vandalism
-
Internal Risks (Human and Systemic Errors)
-
Human Error
- Negligence (e.g., unattended equipment, improper storage)
- Fraudulent claims submission
- Employee errors (miscommunication, documentation mistakes)
-
Systemic and Process Gaps
- Inadequate risk mitigation policies
- Poor loss prevention protocols
- Lack of real-time monitoring systems
-
Human Error
Methodology for Calculating Risk Exposure Scores
Risk exposure scores quantify the potential financial impact of a risk event, combining probability and severity metrics into a single metric. The following methodology employs a weighted scoring system, where each risk category is assigned a base probability and severity score, adjusted by external factors such as location, historical data, and mitigation efforts.
Risk Exposure Score (RES) Formula:
Sample Calculation for Wildfire Risk in a Residential Property:
RES = Σ (Pi × Si × Wi)
Where:
- Pi = Probability of risk occurrence (0 to 1 scale)
- Si = Severity of loss (monetary or categorical scale)
- Wi = Weight factor (reflects insurer-specific risk appetite or regional vulnerabilities)
Assume the following inputs for a property in a high-wildfire-risk zone:
- Probability of wildfire occurrence (Pi) = 0.3 (30% chance annually)
- Severity of loss (Si) = $500,000 (estimated property damage)
- Weight factor (Wi) = 1.5 (adjusted for regional wildfire history and mitigation efforts)
RES = 0.3 × $500,000 × 1.5 = $225,000
The resulting RES of $225,000 indicates the expected annual financial exposure, which insurers use to determine premiums, deductibles, or coverage limits. Adjustments can be made by incorporating:
- Historical claim data from similar properties.
- Mitigation credits (e.g., fire-resistant roofing reduces severity).
- Macroeconomic factors (e.g., inflation impacting repair costs).
Predictive Analytics in Insurance Reporting
Predictive analytics leverages machine learning (ML) and statistical models to forecast claim frequencies, severity, and emerging risks by analyzing historical and real-time data. Insurers deploy these models to enhance underwriting accuracy, detect fraud, and optimize risk mitigation strategies. The following bullet points outline the key algorithms, data inputs, and technical considerations:
-
Algorithms and Models
- Generalized Linear Models (GLMs): Used for claim frequency/severity prediction by modeling relationships between risk factors (e.g., age of property, location) and claim outcomes. Example: Poisson regression for count data.
- Machine Learning Classifiers: Supervised learning models (e.g., Random Forests, Gradient Boosting) classify properties into risk tiers based on labeled historical data. Example: XGBoost for high-dimensional feature sets.
- Time-Series Forecasting: ARIMA or Prophet models analyze temporal patterns (e.g., seasonal claim spikes) to predict future trends. Example: Forecasting hurricane-related claims during peak seasons.
- Deep Learning: Neural networks (e.g., LSTMs) process unstructured data (e.g., satellite imagery for flood risk or IoT sensor data for equipment failures) to identify non-linear risk patterns.
- Anomaly Detection: Isolation Forest or Autoencoders flag unusual claim patterns indicative of fraud or emerging risks. Example: Detecting clusters of arson claims in a specific neighborhood.
-
Data Inputs and Sources
-
Structured Data:
- Claim histories (frequency, payout amounts, cause codes)
- Property characteristics (age, construction materials, location coordinates)
- Policyholder demographics (occupation, credit scores)
-
Unstructured Data:
- Satellite/aerial imagery (for natural disaster risk assessment)
- News/social media feeds (real-time event detection, e.g., protests or wildfires)
- IoT sensor data (e.g., water leak detectors, smoke alarms)
-
External Data:
- Meteorological datasets (NOAA, climate models)
- Crime statistics (FBI UCR, local police reports)
- Economic indicators (construction costs, inflation rates)
-
Structured Data:
-
Implementation Challenges and Solutions
- Data Quality Issues: Missing or biased data (e.g., underreported theft claims) can skew models. Solution: Use data imputation techniques (e.g., k-nearest neighbors) and validate with domain experts.
-
Model Interpretability: Black-box models (e.g., deep
Regulatory and Compliance Requirements in Insurance Reporting
Insurance reporting operates within a complex framework of legal and regulatory obligations designed to protect stakeholders, ensure transparency, and mitigate systemic risks. Non-compliance with these requirements exposes insurers to financial penalties, reputational damage, and legal sanctions. This section examines the critical regulatory standards governing insurance reports, methods for maintaining confidentiality, documentation of compliance audits, and cross-jurisdictional reporting variations.
Legal and Regulatory Standards for Insurance Reports
Insurance reports must align with a diverse set of regulations, varying by jurisdiction and report type (e.g., claims, financial statements, underwriting). Below is a structured checklist of key legal frameworks, their applicability, and associated penalties for non-compliance, presented in a tabular format for clarity.
Regulation Applicable Scenarios Penalties for Non-Compliance General Data Protection Regulation (GDPR) - Processing personal data of policyholders, beneficiaries, or claimants (e.g., medical records, financial details).
- Cross-border data transfers involving EU residents.
- Retention and disposal of sensitive insurance-related data.
- Administrative fines up to 4% of global annual revenue or €20 million (whichever is higher).
- Compensatory damages for affected individuals.
- Reputational harm and loss of customer trust.
Solvency II (EU) - Financial reporting for insurers and reinsurers operating in the EU.
- Risk management disclosures in annual reports.
- Own risk and solvency assessment (ORSA) documentation.
- Regulatory intervention, including capital add-ons or restrictions on distributions.
- Public reprimands and supervisory measures by national competent authorities (NCAs).
- Potential revocation of operating licenses.
National Association of Insurance Commissioners (NAIC) Model Laws (U.S.) - Claims handling and reporting for U.S.-based insurers.
- Annual statement filings (e.g., NAIC Annual Statement Blank).
- Market conduct examinations and fair treatment disclosures.
- Fines ranging from $10,000 to $100,000 per violation (varies by state).
- Suspension or revocation of insurance licenses.
- Mandatory corrective action plans with ongoing monitoring.
Health Insurance Portability and Accountability Act (HIPAA) - Handling protected health information (PHI) in health insurance claims.
- Business associate agreements with third-party vendors (e.g., medical billing services).
- Breach notification requirements for unauthorized disclosures.
- Fines up to $1.5 million per year for repeated violations.
- Civil monetary penalties (e.g., $100–$50,000 per violation).
- Criminal charges for willful neglect (fines up to $50,000 and imprisonment).
International Financial Reporting Standards (IFRS) 17 - Insurance contract accounting and disclosure in financial statements.
- Reporting of contract liabilities and risk adjustments.
- Group-wide insurance reporting for multinational insurers.
- Non-compliance with local GAAP adaptations (e.g., U.S. GAAP vs. IFRS 17).
- Regulatory scrutiny leading to audit adjustments or restatements.
- Loss of investor confidence and reduced access to capital markets.
Local Insurance Laws (e.g., Insurance Act 2015 in India, Insurance Contracts Act 1984 in Australia) - Mandatory disclosures in policy documents and claims settlements.
- Reserve requirements for life and non-life insurance products.
- Consumer protection clauses (e.g., fair claims settlement practices).
- Licensing penalties or operational restrictions.
- Compulsory corrective actions with regulatory oversight.
- Public disclosures of non-compliance (e.g., blacklisting by regulators).
Ensuring Confidentiality in Sensitive Insurance Reports
Sensitive insurance reports—such as those involving claims, underwriting data, or regulatory filings—require robust confidentiality measures to prevent unauthorized access or data breaches. Below are structured steps to implement security protocols, categorized by technical, administrative, and physical controls.Insurance reports often contain proprietary, personally identifiable, or financially sensitive information. Confidentiality breaches can lead to legal liabilities, financial losses, and erosion of stakeholder trust. The following protocols address encryption, access management, and audit trails to mitigate risks:
-
Data Encryption Standards
- Implement AES-256 encryption for data at rest (e.g., databases, cloud storage) and TLS 1.3 for data in transit (e.g., email, APIs).
- Use tokenization for payment card data (PCI DSS compliance) and homomorphic encryption for analytics on encrypted datasets.
- Enforce key management policies, including rotation schedules (e.g., every 90 days) and hardware security modules (HSMs) for master keys.
-
Access Control Mechanisms
- Apply the principle of least privilege, granting access only to roles with legitimate business needs (e.g., claims adjusters, auditors).
- Deploy multi-factor authentication (MFA) for remote access, with time-based or location-based restrictions.
- Integrate role-based access control (RBAC) with automated deprovisioning upon role changes (e.g., via HR system triggers).
-
Documentation and Audit Trails
- Maintain immutable logs of all access attempts, modifications, and deletions, stored in a write-once-read-many (WORM) system.
- Conduct regular access reviews (quarterly) to validate user permissions and revoke inactive accounts.
- Use digital signatures for report approvals and blockchain-based ledgers for critical audit trails (e.g., claims adjustments).
-
Physical and Environmental Security
- Secure report storage facilities with biometric access controls and 24/7 surveillance.
- Implement data destruction protocols (e.g., NAID-certified shredding for physical documents, cryptographic erasure for digital media).
- Deploy ge
Case Studies and Real-World Applications in Insurance Reporting
Insurance reporting systems are validated through real-world applications where structured documentation, forensic analysis, and compliance frameworks intersect with high-stakes claims. These case studies illustrate how insurance reports are constructed under pressure—whether due to fraudulent activities, natural disasters, or cyber threats—while ensuring accuracy, transparency, and regulatory adherence. Below are analyses of high-profile scenarios demonstrating the practical implementation of insurance reporting methodologies.
Analysis of a High-Profile Insurance Fraud Case: Timeline of Critical Events
The 2017 "Operation Wire Fraud" investigation by the FBI and state insurance regulators exposed coordinated fraud schemes targeting commercial property insurers, resulting in over $100 million in false claims across the U.S. The case highlighted systemic vulnerabilities in claim validation processes, particularly in documentation for arson-related losses. Below is a structured timeline of key events extracted from investigative reports and court filings, with red flags identified in the insurance reports:2016 Q3 – Initial Suspicion:
- Multiple insurers receive identical damage reports for small businesses in Texas and Florida, all claiming "suspicious fires" with identical adjuster notes.
- Red flags: Adjuster notes mention "accelerant detected" but lack specific lab reports; photographs show inconsistent burn patterns.
2016 Q4 – Pattern Recognition:
- State fraud units cross-reference claims and identify 12 adjusters linked to 450+ claims with overlapping descriptions (e.g., "smoke damage to roof only").
- Red flags: Adjusters used the same template language; no third-party inspections were documented.
2017 Jan – Forensic Audit Triggered:
- A Texas insurer flags discrepancies in a $2.1M claim for a "warehouse fire" where the reported loss exceeded the insured value by 300%.
- Red flags: Policy limits were inflated retroactively; no pre-loss inventory records submitted.
2017 Mar – Arrests and Confessions:
- FBI raids reveal a ring of adjusters and contractors staging fires using methylated spirits and falsified invoices for "emergency repairs."
- Red flags: Contractor invoices lacked corporate stamps; adjuster notes referenced "client-provided evidence" without chain-of-custody logs.
2017 Nov – Regulatory Action:
- 18 individuals indicted; insurers recover $65M via subrogation. Post-mortem reports cite failures in:
- Documentation gaps: Missing video surveillance footage despite high-risk locations.
- Adjuster bias: Over-reliance on claimant-provided photos (e.g., wide-angle shots hiding structural integrity).
- Lack of geospatial cross-checks: No validation of claimant addresses against GPS data from prior inspections.
Key Takeaway:
The case underscored the necessity of multi-layered verification in insurance reports, including:
- Forensic photography standards (e.g., 360° panoramas, timestamped metadata).
- Cross-referencing adjuster notes with third-party forensic reports.
- Geospatial validation of claimant locations (discussed further in the auto insurance section).
Structured Hurricane Damage Claim Report: Photographic Evidence and Adjuster Notes
Hurricane Ian (2022) generated $112 billion in insured losses, with 60% of claims involving roof and wind damage. A well-documented claim report for a Florida residential property illustrates how photographic evidence and adjuster observations are systematically compiled. Below is a breakdown of the report’s components, formatted as a checklist with contextual explanations:Insurance reports for hurricane damage prioritize visual corroboration of structural integrity, water intrusion, and pre-existing conditions. The adjuster’s field notes and photographs serve as the primary evidence for:
- Covered vs. excluded losses (e.g., wind-driven rain vs. pre-existing rot).
- Mitigation of moral hazard (e.g., proving repairs were not delayed).
- Regulatory compliance (e.g., Florida’s Citizens Property Insurance Corporation requirements for storm-related claims).
Report Structure:
-
Header Information
- Policyholder: [Name], Policy #: [123456789], Insured Property: [123 Ocean Blvd, Clearwater, FL 33765].
- Claim Type: Hurricane Wind/Hail Damage, Reported Date: Oct 1, 2022, Adjuster: [Jane Doe, Lic. #FL-2022-0045].
Note: All dates and license numbers must align with state adjuster databases to prevent fraud.
-
Photographic Evidence Descriptions
-
Exterior Façade (Pre-Storm Baseline)
- Photo 1: South-facing roof with missing shingles along the ridge (evidence of wind uplift).
- Photo 2: Debris line (2x4 lumber) lodged in the eave, consistent with 120+ mph winds.
- Adjuster Note: "No pre-storm photos provided; claimant admits to prior roof leaks but denies prior repairs."
-
Exterior Façade (Pre-Storm Baseline)
-
Interior Damage Assessment
- Photo 3: Water stains on ceiling drywall (ceiling joists exposed), traced to missing shingles.
- Photo 4: Mold growth on bathroom ceiling (adjacent to compromised roof).
- Adjuster Note: "Mold suggests prolonged water exposure; claimant states they boarded windows post-storm (no photos)."
-
Structural Integrity Checks
- Photo 5: Gutter detachment with visible rust (pre-existing condition vs. storm-related).
- Photo 6: Foundation cracks (adjacent to storm surge zone).
- Adjuster Note: "Foundation damage may be excluded if pre-dating policy inception (2020)."
-
Adjuster Field Notes
- Red Flags Identified:
- Claimant provided no video footage despite security cameras being advertised in marketing materials.
- Discrepancy in roof age: Policy states "2018 installation," but shingle condition suggests 2015 vintage.
- Lack of mitigation documentation: No receipts for tarping or temporary repairs, despite adjuster’s recommendation.
- Recommendations:
- Request pre-storm roof inspection reports from the insurer’s historical files.
- Engage a forensic engineer to assess foundation stability.
- Deny mold remediation costs unless linked to storm-related water intrusion (per Florida Statute 627.70131).
-
External Risks (Environmental and Societal Factors)
-
Supporting Documentation
- Weather Data: NOAA Station #12345 confirms 105 mph sustained winds at claimant’s location.
- Contractor Estimates: Three independent roofers cite $18,000–$22,000 for replacement (vs. claimant’s $45,000 estimate).
- Chain of Custody: All photos stored in secure, timestamped cloud repository (e.g., Insurance Claims Evidence Vault).
Geospatial Data Validation in Auto Insurance Reports: Step-by-Step Procedure
Auto insurance fraud involving staged accidents or false location claims accounts for $30 billion annually in losses (ACFE, 2023). Geospatial data—integrating GPS coordinates, telematics, and mapping tools—serves as a critical validation layer in reports. Below is a procedural workflow for verifying accident locations, with emphasis on cross-referencing digital and physical evidence:Geospatial validation reduces false claims by 40% (per NAIC’s Fraud Detection Task Force) through:
Step-by-Step Validation Process:
-
Extract GPS and Telematics Data
- Retrieve Event Data Recorder (EDR) logs from involved vehicles (if equipped) to confirm:
- Timestamp of impact (must align with claimant’s reported time ±5 minutes).
- Speed and direction (e.g., "Claimant states ‘southbound’ but EDR shows ‘northbound’ at impact").
Critical Check: Cross-reference with cell tower pings (via subpoena) to verify location proximity.
-
Overlay
Mastering insurance reporting demands a synthesis of technical rigor, procedural discipline, and an understanding of dynamic industry challenges. From distinguishing between claim and audit reports to applying geospatial data in auto insurance or mitigating risks through predictive analytics, each element plays a critical role in safeguarding financial interests and ensuring transparency. By adhering to structured methodologies, regulatory benchmarks, and evidence-based practices, insurers can transform reports from mere administrative requirements into strategic assets that enhance decision-making and compliance. The insights provided here serve as a foundation for refining reporting processes, ultimately fostering greater accuracy, efficiency, and accountability across the insurance ecosystem.
Leave a Comment
Comments are moderated before appearing. The data you submit is processed according to the Privacy Policy of viralcontentbee.com.