How Much Does Marketing Cost And Key Budget Insights
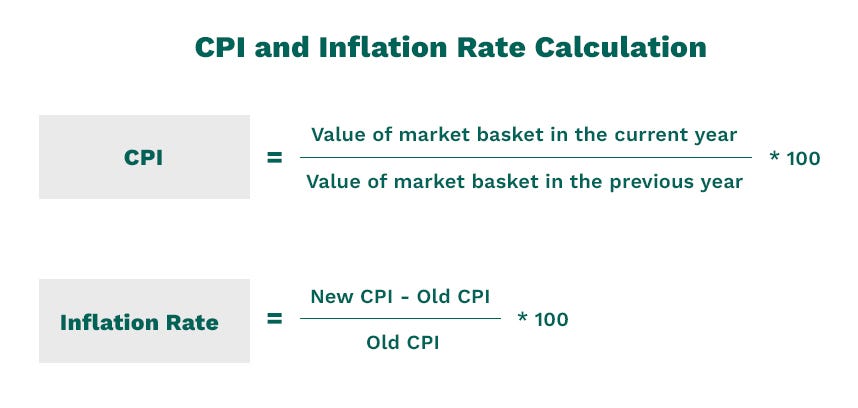
Table of Contents
- Cost Breakdown by Marketing Channel: Traditional vs. Digital Expenses
- Average Cost Ranges for Traditional Marketing Methods
- Structured Comparison: Digital vs. Offline Marketing Costs
- Small Business Budget Allocation Across Marketing Channels
- Factors Influencing Marketing Spend
- Top Five Variables Causing Fluctuations in Marketing Costs
- Comparative Analysis: B2B vs. B2C Marketing Budgets
- Geographic Location and Its Impact on Marketing Costs
- Hidden and Indirect Costs in Marketing Budgets
- Non-Obvious Expenses in Marketing Operations
- Case Studies: Budget Overruns from Overlooked Costs
- Checklist for Identifying Overlooked Indirect Costs
- Cost-Effective Strategies for Maximizing Marketing Impact Across Budgets
- Leveraging Organic Growth and Guerrilla Marketing for High Impact
- Comparing Low-Cost Automation Tools: Scalability for Small vs. Medium Businesses
- A 30-Day Bootstrapped Startup Marketing Plan Under $500
- Lessons from Brands That Scaled with Minimal Spend
- Tools and Resources for Cost Management in Marketing Budgets
- Free and Low-Cost Tools for Tracking Marketing Spend
- Negotiating Better Rates with Vendors Using Data-Driven Approaches
- Subscription-Based Services Ranked by Cost-to-Value Ratio
- Visualizing Marketing Investment for Strategic Decision-Making
- Creating Infographics for Cost vs. Revenue Growth Over Time
- Designing a Real-Time Marketing Spend vs. KPI Dashboard
- Optimizing High-Cost, Low-Performing Pages with Heatmaps
- Generating a Cost-Benefit Analysis Report in Markdown
- FAQ
- What is the typical cost of marketing for a small business?
- How much does marketing cost per month on average?
- What is the average monthly marketing budget for a small business?
- How much does it cost to market on Instagram?
- What is the cost of marketing for a mobile app?
- How much does Facebook marketing cost?
Understanding the financial demands of marketing is essential for businesses seeking sustainable growth. The question of how much does marketing cost transcends simple budget allocation—it requires a strategic evaluation of channel efficiency, hidden expenditures, and scalable solutions tailored to organizational goals. From traditional media to digital innovation, each approach carries distinct cost structures shaped by industry, audience behavior, and competitive dynamics.
This analysis dissects the variables influencing marketing spend, exposes overlooked cost drivers, and equips decision-makers with actionable frameworks to optimize investments. Whether navigating limited resources or enterprise-level allocations, clarity on cost breakdowns, ROI calculation, and cost-effective tactics ensures campaigns deliver measurable returns without compromising long-term objectives.
Cost Breakdown by Marketing Channel: Traditional vs. Digital Expenses
Marketing costs vary significantly across channels, influenced by industry type, audience demographics, and regional demand. Traditional marketing methods such as print, television, and radio remain relevant in specific sectors (e.g., automotive, luxury goods, or local services), while digital channels dominate in scalability and measurable ROI. Below is a structured analysis of average cost ranges, regional variations, and performance metrics to inform budget allocation.Average Cost Ranges for Traditional Marketing Methods
Traditional marketing channels often incur higher upfront costs but provide broad reach in niche or high-intent markets. Costs differ by medium, industry, and geographic location, with urban areas typically commanding premium pricing due to higher audience density.Print Advertising
Television and Radio
Outdoor Advertising
Structured Comparison: Digital vs. Offline Marketing Costs
Digital marketing offers granular targeting, real-time analytics, and lower entry costs compared to traditional channels. Below is a comparative table highlighting key metrics: audience reach, engagement rates, scalability, and cost efficiency.| Metric | Traditional Marketing | Digital Marketing | Notes |
|---|---|---|---|
| Audience Reach | Broad but demographically limited (e.g., TV reaches all ages but may skew older). | Highly targeted (e.g., Google Ads can segment by age, location, interests). | Digital allows hyper-segmentation (e.g., retargeting past visitors). |
| Engagement Rates | Passive (e.g., TV/radio ads rely on ambient exposure). | Active (e.g., email open rates: 15–25%; social media engagement: 1–5%). | Digital enables interactive elements (e.g., click-throughs, surveys). |
| Cost per Impression (CPM) | $5–$50 (print), $10–$100 (TV), $2–$10 (radio). | $0.50–$10 (Google Display), $1–$15 (social media). | Digital CPMs are 50–80% lower for niche audiences. |
| Scalability | Limited (e.g., printing 10,000 flyers vs. scaling digital ads globally). | High (e.g., Facebook Ads can reach millions with incremental spend). | Automation tools (e.g., programmatic ads) reduce manual effort. |
| ROI Tracking | Difficult (e.g., attributing sales to a billboard). | Precise (e.g., UTM parameters, conversion pixels). | Digital allows real-time adjustments based on performance. |
| Budget Flexibility | High upfront costs (e.g., TV spots require bulk purchases). | Pay-per-click (PPC) or performance-based (e.g., cost-per-lead). | Small businesses can start with $500/month on Google Ads. |
Small Business Budget Allocation Across Marketing Channels
Small businesses typically allocate budgets based on industry benchmarks, customer acquisition costs (CAC), and revenue goals. A common distribution prioritizes high-ROI digital channels while reserving traditional methods for niche or local markets.Example Budget Breakdown (Annual $50,000 Marketing Budget)
.png?width=1355&height=1135&name=formula (18).png)
Factors Influencing Marketing Spend
Marketing expenditures vary significantly based on strategic priorities, market dynamics, and operational constraints. Understanding these fluctuations is critical for budget allocation, as costs are not static but influenced by external variables such as audience behavior, competitive landscapes, and regional economic conditions. Below, the analysis explores the top five variables driving cost variations, contrasts B2B and B2C budget structures, examines geographic disparities, and maps how company size dictates marketing investment strategies.Top Five Variables Causing Fluctuations in Marketing Costs
Marketing spend is shaped by a combination of controllable and uncontrollable factors, including audience segmentation, platform economics, and competitive pressures. These variables directly impact channel selection, creative execution, and scalability, necessitating adaptive budgeting frameworks.-
Audience Demographics and Psychographics
Costs escalate with the precision required to target niche segments. For example, hyper-personalized campaigns in industries like luxury retail or B2B SaaS demand advanced data tools (e.g., CRM integration, predictive analytics), increasing expenses by 30–50% compared to broad-based outreach. Demographic shifts—such as the aging population in Japan or the rise of Gen Z in Southeast Asia—also dictate channel preferences (e.g., TikTok for Gen Z vs. LinkedIn for professionals), altering spend allocation. -
Competition Intensity and Market Saturation
Highly competitive sectors (e.g., fintech, e-commerce) inflate costs due to bid inflation on platforms like Google Ads or Meta, where CPC (cost-per-click) can surge by 200–400% during peak seasons. In saturated markets, brands must invest in first-party data strategies or influencer collaborations to differentiate, adding 15–25% to acquisition costs. Conversely, emerging markets with lower competition (e.g., African e-commerce) may offer lower CAC (customer acquisition cost) but require higher creative adaptation budgets. -
Platform Fees and Ad Auction Dynamics
Digital ad spend is heavily influenced by platform policies and algorithmic changes. For instance:- Meta’s iOS tracking restrictions (2021) increased CAC for app installs by 40% for many brands, pushing them toward contextual or lookalike audience targeting.
- Google Ads’ performance max campaigns can drive up costs by 25–50% for brands unprepared for automated bidding strategies.
- Programmatic advertising fees vary by region—North America averages $1.50–$3.00 per impression, while Latin America may see $0.30–$0.80, reflecting inventory quality and demand.
-
Content Production and Creative Complexity
Video content, a dominant trend, can cost 3–10x more than static ads. A 60-second branded video may range from $5,000–$500,000, depending on production quality (e.g., indie films vs. Hollywood-level polish). Interactive content (e.g., AR filters, gamified ads) further amplifies spend, with development costs reaching $50,000–$200,000 for high-end executions. -
Regulatory and Compliance Requirements
Industries like healthcare (HIPAA), finance (GDPR), and pharma face stricter ad placement rules, increasing costs for legal reviews and platform restrictions. For example, pharmaceutical ads on Google must comply with FDA guidelines, requiring additional vetting that adds $10,000–$100,000 to campaign setup. Emerging markets with nascent regulations (e.g., Southeast Asia’s data privacy laws) may impose unexpected compliance costs.
Comparative Analysis: B2B vs. B2C Marketing Budgets
B2B and B2C marketing differ fundamentally in budget allocation, lead generation strategies, and ROI metrics. While B2C focuses on volume and immediate conversions, B2B prioritizes long sales cycles and relationship-building, reflecting divergent cost structures.| Metric | B2B (SaaS Example: HubSpot) | B2C (E-commerce Example: Warby Parker) |
|---|---|---|
| Average Marketing Spend as % of Revenue | 10–20% (e.g., HubSpot allocates ~15% to demand gen, including events, content, and digital ads). | 5–12% (e.g., Warby Parker spends ~8% on performance marketing and influencer partnerships). |
| Customer Acquisition Cost (CAC) | $1,500–$5,000 (long sales cycles; e.g., Salesforce’s CAC exceeds $3,000). | $20–$100 (short cycles; e.g., Amazon’s CAC for Prime sign-ups is ~$35). |
| Primary Channels |
|
|
| Creative and Production Costs | High (custom case studies, executive videos, and interactive demos). | Moderate to low (user-generated content, short-form videos). |
| ROI Focus | Pipeline velocity and deal closure rates (e.g., HubSpot measures SQLs per campaign). | Immediate sales and repeat purchases (e.g., Warby Parker tracks AOV and retention). |
Key Insight: B2B marketing budgets are 3–5x higher per lead than B2C due to longer sales cycles, but B2C achieves higher volume at lower individual costs. SaaS companies often reinvest 50–70% of revenue into growth marketing, while e-commerce brands prioritize scalable, low-CAC channels.
Geographic Location and Its Impact on Marketing Costs
Regional disparities in ad spend, labor rates, and platform availability create significant cost variations. Developed markets like the U.S. and Western Europe dominate digital ad expenditure, while emerging markets offer lower costs but require localized strategies.-
Digital Ad Spend by Region (2023 Estimates)
Region Avg. CPC (Google Search) Avg. CPA (Lead Gen) Platform Penetration North America $1.00–$3.50 $50–$200 High (90%+ smartphone usage). Western Europe $0.80–$2.50 $40–$150 High (85%+ digital adoption). Asia-Pacific (Emerging) $0.10–$0.50 $10–$50 Moderate (60–70% smartphone, rising). Latin America $0.30–$1.00 $20–$80 Growing (50–60% digital, mobile-first
Hidden and Indirect Costs in Marketing Budgets
Marketing budgets often account for direct expenses such as ad spend, creative production, and media placements, but a significant portion of costs remain obscured—either overlooked or buried in operational inefficiencies. These hidden and indirect costs can inflate budgets by 20–50% or more, particularly in campaigns relying on data-driven strategies, compliance-heavy industries, or scalable digital initiatives. For instance, a 2022 study by the Content Marketing Institute found that 68% of marketers underestimated indirect costs, leading to unplanned budget reallocations mid-campaign. Below, an analysis of these costs, their impact on campaign viability, and methodologies to preemptively identify and mitigate them.
Non-Obvious Expenses in Marketing Operations
Beyond visible expenditures like ad spend or event sponsorships, marketing teams incur costs tied to infrastructure, regulatory compliance, and operational overhead. These expenses often lack dedicated line items in budgets but accumulate over time, eroding profitability. Key categories include:- Software and Tool Subscriptions: Marketing technology stacks (e.g., CRM platforms like HubSpot, analytics tools like Google Analytics 4, or automation suites like Marketo) incur recurring fees that scale with usage. For example, a mid-sized e-commerce brand may spend $15,000–$30,000 annually on SaaS tools, yet fail to account for integration costs (API development, custom scripting) or employee training to maximize tool efficiency.
- Data Licensing and Third-Party Integrations: Access to high-quality datasets (e.g., consumer behavior analytics from Nielsen or demographic insights from Experian) can cost $5,000–$50,000 per year, depending on granularity. Additionally, APIs and data feeds from partners (e.g., payment processors, loyalty programs) may impose per-transaction fees or volume-based charges.
- Compliance and Legal Fees: Regulations such as GDPR (General Data Protection Regulation), CCPA (California Consumer Privacy Act), or industry-specific mandates (e.g., HIPAA for healthcare marketing) require legal reviews, data anonymization tools, and potential fines. A 2021 GDPR violation by a European retailer resulted in a €20 million fine after failing to disclose cookie consent mechanisms properly.
- Content Repurposing and Localization: Translating campaigns for global markets or adapting content for multiple formats (e.g., video subtitles, audio descriptions) adds labor and tooling costs. A 2023 Common Sense Advisory report estimated that localization can increase content production costs by 30–100% for non-English markets.
- Influencer and Partnership Overhead: Beyond upfront payments, influencer collaborations involve contract negotiations, performance tracking (e.g., UGC analytics tools), and potential crisis management (e.g., brand safety issues). A 2022 Influencer Marketing Hub survey revealed that 43% of brands faced unexpected costs due to influencer misalignment or contract disputes.
Example of Cost Underestimation:
A direct-to-consumer (DTC) brand launched a TikTok influencer campaign with a $50,000 budget, allocating funds only to creator fees and ad spend. Unaccounted costs included:
- $12,000 for legal review of influencer contracts (to ensure FTC compliance).
- $8,000 in platform fees (TikTok’s Creator Marketplace takes 20–50% of ad spend for promoted content).
- $5,000 in post-campaign analytics tools to verify ROI, which the original budget excluded.
The total actual spend reached $75,000, a 50% overrun, forcing the brand to delay other initiatives.
Case Studies: Budget Overruns from Overlooked Costs
Failed campaigns often serve as cautionary tales for indirect cost neglect. Below are three real-world examples where underestimation led to financial strain or strategic pivots:
Case 1: The $1M GDPR Fine for a Retailer’s Email Campaign
A UK-based fashion retailer launched a large-scale email marketing push using a third-party CRM provider. The campaign relied on purchased contact lists (non-compliant under GDPR) and lacked explicit opt-in mechanisms. When regulators audited the data collection process, the retailer faced:
- €1,000,000 fine for unlawful data processing.
- €250,000 in legal fees to negotiate the penalty.
- €150,000 in CRM migration costs to a GDPR-compliant platform.
Root Cause: The budget allocated £50,000 for "data compliance" but did not account for fines or the need to rebuild email lists from scratch.Case 2: The $200K Social Media Ad Spend Wasted on Unverified Audiences
A SaaS company allocated $200,000 to LinkedIn and Facebook ads targeting "IT decision-makers." However, the campaign suffered from:
- $80,000 in wasted ad spend due to low-quality audience data (e.g., scraped emails, fake profiles).
- $50,000 in retargeting costs after the initial ads failed to convert.
- $30,000 in agency fees to rebuild audience segments.
Root Cause: The budget did not include audience verification tools (e.g., Clearbit, ZoomInfo) or testing for data accuracy, assuming first-party lists would suffice.Case 3: The $150K Influencer Campaign That Went Viral—For the Wrong Reasons
A beauty brand partnered with a micro-influencer for a #GlowUpChallenge, budgeting $150,000 for creator fees and content production. The campaign backfired when:
- The influencer’s past posts resurfaced, revealing misleading claims about product efficacy.
- $40,000 was spent on crisis PR to mitigate damage.
- $30,000 in lost revenue due to unplanned returns and refunds.
Root Cause: The budget excluded influencer vetting tools (e.g., HypeAuditor) and brand safety clauses in contracts.Checklist for Identifying Overlooked Indirect Costs
Teams often assume indirect costs are "part of operations," but proactive audits can reveal hidden expenditures. Below is a comprehensive checklist categorized by cost type, along with actionable steps to quantify them:
-
Technology and Tools
- Review all SaaS subscriptions (e.g., Adobe Creative Cloud, Canva Pro, SEMrush) and calculate per-user licensing costs for scaling teams.
- Audit API and integration fees (e.g., payment gateways, CRM sync tools) for transaction-based charges.
- Estimate training costs for new tools (e.g., $500–$2,000 per employee for advanced analytics platforms).
- Include data storage costs (e.g., AWS S3, Google Cloud) for campaign assets and customer data.
-
Compliance and Legal
- Consult legal counsel to estimate regulatory fines (e.g., GDPR, CCPA) based on data handling practices.
- Budget for consent management tools (e.g., OneTrust, TrustArc) at $10,000–$100,000 annually for enterprise-scale compliance.
- Allocate funds for third-party audits (e.g., SOC 2 compliance for B2B marketing data).
- Factor in contractual penalties (e.g., early termination fees for ad platforms or influencer deals).
-
Content and Creative Production
- Calculate localization costs (translation, cultural adaptation) at 30–100% of base content production costs for non-English markets.
- Include royalty fees for stock media (e.g., music, footage) or custom illustrations.
- Account for content repurposing tools (e.g., Lumen5 for video, Headliner for podcasts) at $50–$500 per project.
- Budget for archival and version control (e.g., Dropbox Business, Bynder) to avoid recreating lost assets.
-
Partnerships and External Collaborations
- Negotiate performance-based clauses in influencer contracts to cap costs if KPIs aren’t met.
- Include contingency funds (10–20%) for unexpected influencer or agency fees
Cost-Effective Strategies for Maximizing Marketing Impact Across Budgets
Marketing efficiency is not dictated by budget size but by strategic allocation, resourcefulness, and execution. Businesses with limited financial resources can achieve outsized returns by prioritizing high-impact, low-cost tactics—such as organic growth, automation, and guerrilla marketing—while scaling incrementally. This section explores actionable frameworks tailored to small, medium, and bootstrapped enterprises, comparing tools, prioritizing tasks, and drawing lessons from brands that scaled with minimal spend.
Leveraging Organic Growth and Guerrilla Marketing for High Impact
Organic strategies reduce reliance on paid channels while building long-term brand equity. Guerrilla marketing—defined by creativity over capital—exploits unconventional, high-visibility tactics to generate buzz with minimal investment. For example, Dollar Shave Club’s 2012 viral video ("Our Blades Are F*ing Great") cost under $5,000 to produce but generated 12,000+ YouTube subscribers in 48 hours, leading to a $200 million acquisition by Unilever. The key lies in content that solves a problem, tells a story, or disrupts expectations—without requiring a large ad spend.Organic social media, when executed systematically, serves as a scalable alternative to paid promotion. Platforms like LinkedIn (B2B), Instagram (visual storytelling), and TikTok (short-form engagement) offer built-in algorithms that amplify reach without direct spend. A structured approach includes:
- Content Repurposing: Convert blog posts into infographics, carousels, or short videos (e.g., using Canva’s free tools).
- Community Engagement: Participate in niche forums (Reddit, Quora) or host AMAs (Ask Me Anything) to establish authority.
- User-Generated Content (UGC): Encourage customers to share testimonials or branded posts (e.g., GoPro’s #GoProHero challenge).
- Collaborations: Partner with micro-influencers (1K–50K followers) for authentic promotion, often at a fraction of agency rates.
For guerrilla tactics, focus on ambient marketing—placing branded messages in unexpected spaces—such as:
- Street Art: Stickers, chalk messages, or pop-up installations in high-traffic areas.
- Flash Mobs: Coordinate a brief, memorable performance (e.g., Blendtec’s "Will It Blend?" stunts).
- Referral Incentives: Offer discounts or freebies for customer referrals (e.g., Dropbox’s early viral growth via invite-only signups).
Comparing Low-Cost Automation Tools: Scalability for Small vs. Medium Businesses
Automation streamlines repetitive tasks, allowing businesses to scale operations without proportional cost increases. The choice of tool depends on budget, team size, and growth stage, with free or freemium tiers often sufficient for startups. Below is a comparison of leading platforms, categorized by functionality and scalability:
Critical Considerations for Scalability:Tool Category Small Business (0–50 Employees) Medium Business (50–200 Employees) Key Differentiator Email Marketing Mailchimp (Free up to 500 contacts) HubSpot (Free plan + paid add-ons) HubSpot integrates CRM; Mailchimp excels in design templates. Customer Support Zendesk Sunrise (Free tier) Intercom (Custom pricing) Intercom offers advanced segmentation; Sunrise is simpler. Social Media Scheduling Buffer (Free for 3 channels) Hootsuite (Pro plan starts at $99/mo) Hootsuite supports bulk scheduling; Buffer focuses on simplicity. CRM & Sales Automation HubSpot (Free CRM) Salesforce Essentials ($25/user/mo) Salesforce scales for enterprise; HubSpot is user-friendly. Analytics Google Analytics (Free) Adobe Analytics (Enterprise pricing) Adobe offers deeper insights but requires technical expertise.
- Integration Ecosystem: Tools like HubSpot or Zapier connect multiple platforms (e.g., email + CRM + social), reducing manual data entry.
- Team Collaboration: Medium businesses need role-based permissions (e.g., HubSpot’s team access controls).
- Data Exportability: Ensure tools allow CSV exports or API access for migration if switching providers.
- Hidden Costs: Some "free" tiers impose limits (e.g., Mailchimp charges for advanced features like A/B testing).
For bootstrapped teams, Zapier (free for 100 tasks/month) bridges gaps between disparate tools, while Google Workspace (free for up to 10 users) provides unified email, docs, and calendar management.
A 30-Day Bootstrapped Startup Marketing Plan Under $500
Launching a campaign with constrained resources requires prioritization, rapid iteration, and leveraging free/low-cost assets. Below is a phased 30-day plan for startups with under $500, allocated across branding, content, outreach, and analytics.Phase 1: Foundation (Days 1–7) – $100
- Branding & Assets:
- Design a logo and basic visual identity using Canva Pro (free trial) or Looka.
- Create a one-page website (e.g., Carrd at $9/year) with a clear value proposition and CTA.
- Content Pipeline:
- Write 3 blog posts or guides (hosted on Medium or LinkedIn for free distribution).
- Record 2 short videos (e.g., "How It Works" or "Founder Story") using a smartphone and CapCut (free editing).
- Outreach Setup:
- Claim business profiles on Google My Business, LinkedIn, and Instagram.
- Set up a free Mailchimp account and collect 50+ emails via a lead magnet (e.g., checklist, template).
Phase 2: Execution (Days 8–21) – $300
- Organic Growth:
- Post 3x/week on LinkedIn/Instagram (mix of content: educational, promotional, UGC).
- Engage in 2 niche Facebook Groups or Reddit threads daily (answer questions, avoid spam).
- Launch a referral program (e.g., "Get 10% off for every friend who signs up").
- Paid Micro-Campaigns:
- Allocate $100 to Facebook/Instagram ads targeting lookalike audiences (use a small budget for retargeting).
- Sponsor a local event or podcast ($50–$100) for brand exposure.
- Automation:
- Set up Zapier automations (e.g., new email signups → add to Google Sheet).
- Use free Canva templates for social media scheduling.
Phase 3: Optimization (Days 22–30) – $100
- Analytics & Adjustments:
- Track Google Analytics 4 (free) for website traffic sources.
- Review Mailchimp/Instagram Insights to double down on high-performing content.
- Scaling Tactics:
- Repurpose top-performing content into LinkedIn carousels or Twitter threads.
- Pitch 1 micro-influencer (offer free product/service in exchange for posts).
- Budget Reallocation:
- Shift remaining funds to highest-ROI channels (e.g., if email converts well, boost Mailchimp’s paid features).
Key Metrics to Monitor:
- Conversion Rate: Track website signups, downloads, or purchases.
- Engagement Rate: Likes, shares, and comments on social media.
- Customer Acquisition Cost (CAC): Divide total spend by new customers acquired.
Lessons from Brands That Scaled with Minimal Spend
"Marketing is no longer about the stuff that you make, but the stories you tell." — Seth Godin
Companies that achieved viral growth with limited budgets share three recurring strategies:
1. Storytelling Over Selling: Brands like Dollar Shave Club and Airbnb (early "Belong Anywhere" campaign) focused on emotional hooks rather than product features.
2. Leveraging Existing Platforms: Duolingo’s owl mascot became iconic through organic TikTok trends, costing nothing beyond creative direction.
3. Community-Driven Growth: Patagonia’s "1% for the Planet" turned customers into activists, amplifying reach through shared values.Case Study: Dollar Shave Club
- Tactic: A single viral video (production budget: ~$4,50
Tools and Resources for Cost Management in Marketing Budgets
Effective cost management in marketing relies on leveraging the right tools and resources to optimize spend, track performance, and negotiate favorable terms with vendors. The selection of tools varies by business stage, budget constraints, and marketing objectives, ranging from free open-source solutions to premium subscription services. Below are structured recommendations for tracking expenses, negotiating vendor rates, evaluating subscription-based services, and standardizing procurement processes through RFPs.
Free and Low-Cost Tools for Tracking Marketing Spend
Free and low-cost tools provide essential functionalities for monitoring expenses, analyzing performance, and automating workflows without significant upfront investment. These tools are particularly valuable for startups, small businesses, and budget-conscious marketers. The following curated list includes platforms categorized by their primary use case, along with step-by-step setup instructions to ensure seamless integration into existing workflows.Google Analytics 4 (GA4) – Website Traffic and Conversion Tracking
Google Analytics remains the industry standard for measuring website traffic, user behavior, and conversion metrics. Its free tier offers robust reporting capabilities, including cost-per-acquisition (CPA) tracking and attribution modeling. To set up GA4:
1. Create a Google Analytics account and property via Google’s Analytics setup guide.
2. Install the global site tag (gtag.js) or use Google Tag Manager (GTM) for advanced tracking.
3. Configure goals and events (e.g., form submissions, product views) under Admin > Goals.
4. Integrate with Google Ads or other ad platforms to import cost data for CPA analysis.
5. Use Explore reports to analyze marketing channel performance by cost and revenue impact.Canva – Design and Content Creation
Canva’s free plan provides access to thousands of templates for social media, email marketing, and branding, reducing outsourcing costs. To optimize usage:
- Use the Brand Kit feature to maintain consistent visual identity.
- Leverage the Magic Resize tool to repurpose content across platforms.
- For advanced features (e.g., stock photos, animations), upgrade to Canva Pro ($12.99/month) when scaling content production.
Buffer – Social Media Scheduling and Analytics
Buffer’s free plan allows scheduling up to 10 posts per channel with basic analytics. For cost-effective scaling:
1. Connect social media accounts (Twitter, LinkedIn, Instagram) via Buffer’s dashboard.
2. Use the Analytics tab to track engagement metrics (likes, shares, clicks) and correlate with ad spend.
3. Upgrade to Buffer’s Essentials plan ($6/month per channel) for team collaboration and advanced reporting.Wave Apps – Accounting and Invoicing for Freelancers/Agencies
Wave offers free accounting software for tracking marketing expenses, invoicing clients, and managing receipts. Key features include:
- Expense tracking with categorization by marketing channels (e.g., PPC, influencer collaborations).
- Receipt scanning via mobile app to automate expense logging.
- Invoicing templates for agencies to standardize billing (e.g., hourly rates vs. project-based fees).
HubSpot Free Tools – CRM and Marketing Automation
HubSpot’s free CRM and marketing tools enable tracking leads, email campaigns, and ROI. Critical setup steps:
1. Install the HubSpot tracking code on websites to monitor visitor behavior.
2. Use HubSpot’s free email marketing tool to send campaigns with open/click tracking.
3. Integrate with Google Ads or Facebook Ads via HubSpot’s Ads API for unified reporting.
4. Leverage HubSpot’s free reporting dashboard to calculate customer acquisition cost (CAC) by channel.
Negotiating Better Rates with Vendors Using Data-Driven Approaches
Negotiating lower rates or better terms with vendors—whether ad platforms, agencies, or freelancers—requires leveraging performance data, market benchmarks, and structured contract clauses. Below are tactical strategies to strengthen negotiation positions, supported by real-world examples and key negotiation levers.Step 1: Benchmark Performance Against Industry Standards
Vendors are more likely to adjust rates if they perceive underperformance relative to industry averages. Use tools like:
- WordStream’s PPC Benchmark Reports (e.g., average CPC by industry for Google Ads).
- HubSpot’s Marketing Benchmarks (e.g., email open rates, social media engagement).
- SEMrush’s Traffic Analytics (for organic search performance comparisons).
Example Negotiation Script:
> "Our current CPA for Google Ads is $45, which is 20% above the $36 industry average for our sector (per WordStream). Given our consistent 15% MoM revenue growth, we’d like to discuss a 15% reduction in management fees to align with our improved efficiency."Step 2: Consolidate Spend for Volume Discounts
Ad platforms (Google, Meta) and agencies often offer tiered pricing based on spend volume. Strategies include:
- Bundling campaigns (e.g., combining Google Ads and YouTube Ads under one account).
- Committing to annual contracts (e.g., Meta’s "Annual Commitment" discounts for $10K+ spend).
- Negotiating "spend guarantees" where vendors offer lower CPMs in exchange for guaranteed monthly budgets.
Step 3: Request Custom Reporting and Transparency
Demand detailed performance reports to identify inefficiencies. Key clauses to include in contracts:
- Monthly performance reviews with actionable insights (e.g., "Identify underperforming keywords and suggest optimizations").
- Attribution modeling adjustments (e.g., switching from last-click to data-driven attribution).
- Audit rights to verify ad spend accuracy (e.g., "Quarterly reconciliation of invoiced vs. actual spend").
Step 4: Leverage Competitive Bidding
Use tools like AdSpy or SimilarWeb to gather competitor ad spend data. Example:
> "Competitor X achieves a 30% lower CPA with your agency. Can you replicate their strategy for our account at a comparable rate?"Step 5: Negotiate Flexible Contract Terms
- Performance-based pricing: Tie agency fees to KPIs (e.g., "10% of incremental revenue generated").
- Phased payments: Request 30% upfront, 40% mid-project, and 30% upon delivery.
- Exit clauses: Ensure contracts allow termination with minimal penalties if performance falls below benchmarks.
Subscription-Based Services Ranked by Cost-to-Value Ratio
Subscription-based marketing tools vary in cost and value depending on business stage (startup, growth, enterprise). Below is a ranked table comparing tools by cost-to-value ratio, categorized by use case and business maturity. Ratings are based on ROI potential, scalability, and feature depth.
Tool Category Service Startup (<$5K MRR) Growth ($5K–$50K MRR) Enterprise ($50K+ MRR) Key Value Proposition SEO & Content Ubersuggest (Free/Pro) $29/month (Pro) $99/month (Team) $499/month (Enterprise) Keyword research, site audits, and backlink tracking with high accuracy for small budgets. Ahrefs N/A (Minimum $99/month) $199/month (Standard) $999/month (Advanced) Comprehensive backlink analysis and rank tracking; ideal for competitive industries. Surfer SEO $89/month (Basic) $249/month (Pro) $499/month (Enterprise) AI-driven content optimization with SERP analysis; best for content-heavy strategies. Ad Platforms Google Ads Pay-per-click (no base fee) Custom bidding strategies (e.g., tCPA) Dedicated account managers and API access Scalable with performance max campaigns; enterprise features include cross-device tracking. Meta Ads Manager Pay-per-click (no base fee) Advanced audience insights
Visualizing Marketing Investment for Strategic Decision-Making
Effective marketing investment visualization transforms raw financial and performance data into actionable insights. By leveraging infographics, real-time dashboards, and analytical tools, organizations can align spending with revenue growth, identify inefficiencies, and optimize resource allocation. This section explores structured methods to create visual representations of marketing costs versus revenue, track key performance indicators (KPIs), and utilize heatmaps for performance optimization. Additionally, a standardized template for cost-benefit analysis reports ensures transparency in comparing in-house versus outsourced strategies.
Creating Infographics for Cost vs. Revenue Growth Over Time
Infographics simplify complex financial data into digestible visuals, making it easier to communicate the relationship between marketing spend and revenue growth to stakeholders. Tools like Canva and Piktochart offer customizable templates that integrate with data sources such as Google Analytics, CRM systems, or spreadsheet tools like Excel or Google Sheets.Key elements to include in a marketing cost-revenue infographic:
- Timeline axis: Representing months, quarters, or years to show progression.
- Cost breakdown: Bar or line graphs depicting marketing spend by channel (e.g., digital ads, content, SEO, events).
- Revenue growth: Overlaid line or area chart showing incremental revenue attributed to marketing efforts.
- ROI highlights: Callout boxes or annotations emphasizing high-impact campaigns or periods of significant return.
- Color coding: Differentiating spend categories (e.g., blue for digital, green for offline) and revenue trends (e.g., red for losses, green for gains).
Example structure using Canva:
1. Data preparation: Export spend and revenue data from tools like HubSpot, Salesforce, or Adobe Analytics into a CSV or Excel file.
2. Template selection: Choose a "timeline" or "comparison" template in Canva, ensuring it supports layered data visualization.
3. Graph customization:
- Use stacked bar charts to show cumulative spend by quarter, with revenue as a secondary axis.
- Add trend lines to illustrate correlation between spend and revenue growth.
4. Design refinements:
- Incorporate icons (e.g., dollar signs for costs, upward arrows for revenue) to enhance clarity.
- Include tool tips (via Canva’s interactive features) to explain specific data points on hover.
5. Export and share: Publish as an interactive PDF or embed directly into reports for stakeholder access.Best practices for clarity:
- Limit data points to 3–5 key metrics to avoid cognitive overload.
- Use consistent scales for both axes to prevent misinterpretation.
- Include a legend explaining abbreviations (e.g., "CAC" for Customer Acquisition Cost).
Designing a Real-Time Marketing Spend vs. KPI Dashboard
A dynamic dashboard consolidates spend data with KPIs such as leads generated, conversion rates, and customer lifetime value (CLV). Tools like Google Data Studio, Tableau, or Power BI enable real-time updates, while custom-built dashboards (using JavaScript libraries like D3.js) offer advanced interactivity. The goal is to provide a single pane of glass for marketers to monitor performance and adjust budgets proactively.Essential components of an effective dashboard:
- Spend tracking panel:
- Pie charts for budget allocation by channel (e.g., 40% digital, 30% content, 20% events).
- Line graphs showing monthly spend trends with alerts for over-budget scenarios.
- KPI performance metrics:
- Lead generation: Bar charts comparing targets vs. actuals, segmented by campaign.
- Conversion rates: Heatmaps or funnel visualizations to identify drop-off points.
- Customer acquisition cost (CAC): Table comparing CAC to lifetime value (LTV) by channel.
- Revenue attribution:
- Waterfall charts to display revenue contribution by marketing touchpoint (e.g., first-click, last-click, multi-touch).
- ROAS (Return on Ad Spend) benchmarks for paid channels like Google Ads or Meta.
- Alert systems:
- Conditional formatting (e.g., red for underperforming campaigns, green for exceeding targets).
- Email/SMS notifications for anomalies (e.g., sudden drops in traffic or cost spikes).
Implementation steps for Google Data Studio:
1. Connect data sources:
- Link Google Ads, Facebook Ads Manager, and CRM data via API or manual uploads.
- Use BigQuery for large datasets or Google Sheets for simpler integrations.
2. Create scorecards:
- Add widgets for total spend, leads generated, and conversion rate.
- Set targets (e.g., 10% MoM growth in leads) to auto-highlight progress.
3. Build interactive filters:
- Allow users to segment data by campaign, region, or time period.
- Use date range controls for dynamic comparisons.
4. Automate updates:
- Schedule daily/weekly refreshes to ensure real-time accuracy.
- Embed the dashboard in Slack or Microsoft Teams for team-wide visibility.
Example dashboard layout (logical flow):
[Header: "Marketing Performance Dashboard | [Date Range]"]
├── [Top Row: Spend Overview (Pie Chart + Line Graph)]
├── [Middle Row: KPIs (Leads | Conversions | CAC)]
├── [Bottom Row: Attribution (Waterfall Chart) + Alerts]
└── [Sidebar: Filters (Channel | Campaign | Time)]
Optimizing High-Cost, Low-Performing Pages with Heatmaps
Heatmaps reveal user interaction patterns on websites or landing pages, highlighting areas with high engagement (e.g., buttons, CTAs) and drop-off points. Tools like Hotjar, Crazy Egg, or Microsoft Clarity overlay session recordings with heatmaps to identify inefficiencies in design or content. This data informs A/B testing and cost-saving optimizations for underperforming assets.Steps to identify and optimize low-performing pages:
1. Tag high-traffic, high-spend pages:
- Focus on landing pages, product pages, or blog posts tied to paid campaigns.
- Exclude pages with low traffic (e.g., <100 visits/month) to prioritize impactful changes.
2. Generate heatmaps:
- Use Hotjar’s "Heatmaps" feature to capture:
- Click maps: Areas users interact with most/least.
- Scroll maps: Percentage of users reaching key content sections.
- Move maps: Mouse movement patterns indicating confusion.
- Segment data by device type (desktop vs. mobile) to uncover platform-specific issues.
3. Analyze drop-off points:
- Low-click CTAs: Redesign buttons to improve visibility (e.g., contrast, placement).
- Ignored content: Simplify copy or use highlighting (e.g., bold text, icons) to draw attention.
- Friction points: Streamline forms (e.g., reduce fields, add progress indicators).
4. Prioritize fixes based on cost impact:
- Calculate cost per visit for the page (e.g., $0.50 via paid ads) and multiply by drop-off rate (e.g., 60%) to estimate lost revenue.
- Example: A page with 10,000 visits/month and 40% drop-off at the CTA costs $5,000/month in ads. Reducing drop-off by 10% could save $2,000/month.
Example optimization workflow for a product page:
- Issue identified: Heatmap shows 70% of users scroll past the "Add to Cart" button.
- Action taken:
- Move the button to above the fold (reducing scroll dependency).
- Increase button size by 44% (improving click-through rate).
- Add a sticky bar with a secondary CTA for mobile users.
- Result: 22% increase in conversions, reducing CAC by $1.20 per customer.
Integration with A/B testing:
- Use Google Optimize or VWO to test changes against original versions.
- Allocate 20–30% of traffic to the variant to ensure statistical significance.
- Monitor revenue impact for 4 weeks before scaling successful changes.
Generating a Cost-Benefit Analysis Report in Markdown
A structured cost-benefit analysis (CBA) report compares financial and operational trade-offs between in-house and outsourced marketing strategies. Using Markdown ensures readability and compatibility with tools like GitHub, Notion, or Confluence. The report should include tables, formulas, and qualitative insights to support data-driven decisions.Template for a Markdown CBA report:
# Marketing Cost-Benefit Analysis: In-House vs. Outsourced
Effective marketing budgeting is not merely about allocating funds but about aligning spend with performance, visibility, and scalability. By leveraging data-driven tools, negotiating transparent vendor agreements, and auditing hidden expenses, businesses can transform cost constraints into competitive advantages. The most successful strategies balance precision with adaptability—whether through guerrilla tactics for startups or automated analytics for scaling enterprises. Ultimately, the answer to how much does marketing cost lies in strategic execution, where every dollar invested contributes to tangible growth.
FAQ
What is the typical cost of marketing for a small business?
Marketing costs for a small business vary widely but often range from $500 to $5,000 per month, depending on the channels (digital ads, SEO, social media, etc.), industry, and goals. Basic DIY efforts (e.g., organic social media) may cost $0–$500/month, while paid campaigns (Google/Facebook ads) can exceed $2,000+/month. Startups may spend $2,000–$10,000 in their first year to establish brand presence.
How much does marketing cost per month on average?
Monthly marketing costs depend on strategy, but small businesses typically spend $500–$5,000, while larger companies allocate $10,000–$50,000+. Organic methods (content, SEO) cost less ($200–$2,000), while paid ads (PPC, social media) can range from $1,000 to $10,000+. Agencies or freelancers charge $1,500–$10,000/month for managed services.
What is the average monthly marketing budget for a small business?
Most small businesses budget $500–$5,000/month for marketing, with $1,000–$3,000 being common for mid-sized teams. Startups often allocate 5–10% of revenue (e.g., $1,000–$5,000 if earning $20K–$100K/month). Costs rise with paid ads ($500–$5,000+) or outsourcing (agencies charge $2,000–$10,000/month).
How much does it cost to market on Instagram?
Organic Instagram marketing (posts, Stories, Reels) costs $0–$500/month for DIY efforts, including tools like Canva ($12/month) or scheduling apps ($10–$50/month). Paid ads start at $500–$2,000/month for small budgets, scaling to $5,000–$20,000+ for high-volume campaigns. Influencer collaborations cost $100–$10,000+ per post, depending on follower count.
What is the cost of marketing for a mobile app?
App marketing costs vary widely: ASO (App Store Optimization) runs $500–$5,000 one-time or $500–$3,000/month. Paid ads (Google, Facebook, TikTok) average $1,000–$10,000/month, while influencer promotions cost $500–$20,000+. Total first-year budgets for new apps often range from $10,000–$100,000+, depending on competition and scale.
How much does Facebook marketing cost?
Facebook ad costs depend on goals: $500–$2,000/month for small businesses targeting local audiences, while larger campaigns can exceed $10,000/month. Cost-per-click (CPC) averages $0.50–$5.00, and cost-per-lead ranges from $5–$50. Organic posting (no ads) costs $0–$300/month for tools and content creation. Retargeting or high-intent campaigns may require $3,000–$50,000+ annually.
Leave a Comment
Comments are moderated before appearing. The data you submit is processed according to the Privacy Policy of viralcontentbee.com.