Data Analytics Drives Modern Marketing Success

Table of Contents
- Foundations of Data Analytics in Marketing
- Core Principles of Data-Driven Decision-Making
- Integration of Data Sources into Marketing Workflows
- Comparison of Traditional Marketing Metrics vs. Data Analytics-Driven KPIs
- Step-by-Step Procedure for Validating Data Sources in Marketing
- Tools and Technologies for Data Analytics in Marketing
- Functionalities of Leading Analytics Platforms
- Open-Source vs. Proprietary Tools: Cost, Scalability, and Learning Curves
- Customer Segmentation and Personalization Strategies
- RFM Analysis for Customer Segmentation
- Workflow for Implementing Personalized Marketing Campaigns
- Batch vs. Real-Time Personalization: Comparative Framework
- Predictive and Prescriptive Analytics in Marketing
- Time-Series Forecasting for Sales and Customer Churn
- Prescriptive Analytics for Marketing Budget Allocation
- Constraints: A_ub x <= b_ub
- Bounds: Each channel must spend at least $1,000
- Ethics, Privacy, and Compliance in Data-Driven Marketing
- Regulatory Frameworks Governing Customer Data Usage
- Anonymization and Pseudonymization Techniques
- Consent Management Protocols
- Step-by-Step Guide to Auditing Marketing Data Pipelines
- Ethical Dilemmas in Marketing Analytics and Resolution Frameworks
- Case Studies and Real-World Applications in Marketing Analytics
- Framework for Analyzing Marketing Analytics Success Stories
- Leveraging Unstructured Data for Marketing Strategy Refinement
- Comparative Analysis: E-Commerce vs. B2B Data Analytics Challenges
- Hypothetical Marketing Analytics Project: Agile Workflow from Problem Definition to Deployment
- FAQ
- What is a data analytics and marketing course, and what skills does it teach?
- What types of jobs are available in data analytics and marketing, and what do they pay?
- How does data science intersect with marketing, and what are key applications?
- What does a data analyst in marketing do, and what tools do they use?
- How can data analysis improve marketing strategies and ROI?
- What are the most in-demand jobs for data analysts in marketing, and how do I get hired?
Data analytics and marketing have evolved into a symbiotic relationship where actionable insights transform raw customer interactions into strategic advantages. Organizations leveraging structured data collection, predictive modeling, and real-time analytics no longer operate on intuition alone but on measurable trends, behavioral patterns, and automated optimization. This integration bridges the gap between consumer expectations and brand performance, enabling precision in targeting, resource allocation, and campaign effectiveness. The fusion of statistical rigor with creative marketing strategies redefines how businesses engage audiences, reduce wasteful spend, and foster long-term loyalty.
The foundation of this paradigm shift lies in the seamless integration of data workflows—from CRM systems and web analytics to social media metrics—into cohesive marketing ecosystems. By validating data sources, mitigating biases, and translating complex datasets into clear KPIs, marketers gain the ability to anticipate market shifts, personalize customer journeys, and allocate budgets dynamically. Emerging technologies, such as AI-driven sentiment analysis and prescriptive algorithms, further amplify this capability, turning data into a competitive differentiator rather than a passive byproduct of operations.

Foundations of Data Analytics in Marketing
Data-driven decision-making in marketing transforms raw data into actionable insights, enabling precise targeting, optimized resource allocation, and measurable performance improvements. At its core, this approach leverages statistical methods—such as regression analysis, hypothesis testing, and A/B testing—to identify patterns, validate assumptions, and predict future trends. Predictive modeling further refines this process by using historical data to forecast customer behavior, campaign outcomes, and market shifts. The integration of data sources like CRM systems, web analytics tools, and social media platforms creates a unified view of customer interactions, allowing marketers to align strategies with data-backed evidence rather than intuition.The effectiveness of data analytics in marketing hinges on the seamless integration of data collection, processing, and application. CRM systems capture transactional and behavioral data, while web analytics tools (e.g., Google Analytics) track user engagement metrics. Social media platforms provide sentiment analysis and demographic insights, collectively forming a 360-degree view of the customer journey. This structured data flow ensures that marketing workflows—from segmentation to personalization—are grounded in real-time, high-quality information.
Core Principles of Data-Driven Decision-Making
Data-driven marketing relies on three foundational principles: quantitative validation, causal inference, and iterative optimization.Quantitative Validation ensures decisions are supported by empirical evidence, reducing reliance on anecdotal or subjective judgments. For example, a campaign’s success is measured not by perceived engagement but by metrics like click-through rates (CTR) and conversion funnels.Statistical methods play a critical role in this validation. Regression analysis identifies relationships between variables (e.g., ad spend and sales), while hypothesis testing (e.g., chi-square tests) determines whether observed effects are statistically significant. Predictive modeling, using techniques like logistic regression or machine learning algorithms, anticipates customer actions (e.g., churn probability or purchase likelihood) based on historical trends.
Causal Inference distinguishes correlation from causation, ensuring that observed patterns directly influence outcomes. For instance, a rise in website traffic may correlate with increased ad spend, but randomized controlled trials (RCTs) or quasi-experimental designs (e.g., difference-in-differences) confirm whether the ad spend caused the traffic surge.Finally, iterative optimization involves continuous testing and refinement. Tools like multivariate testing (MVT) evaluate the impact of multiple variables (e.g., ad copy, imagery, and CTA placement) simultaneously, while bandit algorithms dynamically allocate resources to the most promising variants in real time.
Integration of Data Sources into Marketing Workflows
The convergence of disparate data sources—each with unique strengths—forms the backbone of modern marketing analytics. Below is a structured breakdown of how these sources integrate into key workflows:CRM Systems (e.g., Salesforce, HubSpot) store transactional, demographic, and interaction data, enabling customer segmentation and lifetime value (LTV) analysis. For example, a retail CRM might track purchase history to identify high-value segments for targeted email campaigns.
Web Analytics (e.g., Google Analytics 4, Adobe Analytics) monitor user behavior, including session duration, bounce rates, and conversion paths. These metrics inform website optimization and user experience (UX) improvements, such as A/B testing landing pages for higher engagement.
Social Media Data (e.g., Facebook Insights, Twitter API) provide sentiment analysis, influencer reach, and viral potential metrics. Brands use this to tailor social listening strategies and content calendars, ensuring alignment with audience preferences.
Third-Party Data (e.g., Nielsen, Experian) supplements first-party data with external insights, such as market trends or competitive benchmarks. This is critical for market expansion strategies and pricing optimization.Integration Workflow Example:
1. Data Collection: CRM captures customer data; web analytics tracks online behavior; social media APIs pull engagement metrics.
2. Data Unification: Tools like ETL (Extract, Transform, Load) pipelines (e.g., Talend, Informatica) consolidate these sources into a data warehouse (e.g., Snowflake, BigQuery).
3. Analysis: SQL queries or BI tools (e.g., Tableau, Power BI) generate insights, such as customer journey maps or attribution models.
4. Action: Marketing automation platforms (e.g., Marketo, ActiveCampaign) trigger personalized campaigns based on segmented data.
Comparison of Traditional Marketing Metrics vs. Data Analytics-Driven KPIs
Traditional marketing metrics often focus on surface-level outcomes, while data analytics-driven KPIs provide deeper insights into customer value and long-term performance. Below is a comparative table:| Traditional Metrics | Data Analytics-Driven KPIs | Key Insight |
|---|---|---|
| Impressions | Cost per Thousand Impressions (CPM) with Attribution Modeling | Measures not just reach but the incremental value of each impression in driving conversions. |
| Conversions (e.g., form submissions) | Customer Lifetime Value (CLV) and Conversion Path Analysis | Assesses the long-term revenue potential of a converted user, not just immediate actions. |
| Engagement Rate (Likes/Shares) | Net Promoter Score (NPS) and Sentiment Analysis | Evaluates true brand advocacy beyond superficial interactions. |
| Click-Through Rate (CTR) | Personalization Impact Score (e.g., lift in CTR from dynamic content) | Quantifies the effectiveness of tailored messaging versus generic campaigns. |
| Return on Ad Spend (ROAS) | Incremental ROAS (controlling for organic growth) | Isolates the true impact of ad spend by excluding baseline growth. |
| Customer Acquisition Cost (CAC) | CAC Payback Period and Churn Rate | Determines how quickly acquired customers recoup their cost and the risk of losing them. |
Data analytics-driven KPIs move beyond vanity metrics to predictive and prescriptive insights. For example, while traditional metrics might show a high CTR, analytics can reveal whether those clicks lead to high-intent users (e.g., those who engage with multiple pages before conversion) or low-value traffic (e.g., bots or accidental clicks).
Step-by-Step Procedure for Validating Data Sources in Marketing
Data validation ensures accuracy, consistency, and reliability before analysis. Below is a structured procedure to validate marketing data sources, including cleansing techniques and bias detection frameworks.Step 1: Define Data RequirementsStep 2: Data Cleansing Techniques
Align validation criteria with business objectives. For example:
CRM Data: Validate customer IDs, transaction dates, and purchase amounts for completeness. Web Analytics: Ensure session data matches user acquisition sources (e.g., no duplicate or missing referrer tags).
Data cleansing removes errors and inconsistencies. Common methods include:
-
Handling Missing Values:
- Deletion: Remove records with critical missing fields (e.g., email addresses in a CRM).
- Imputation: Replace missing values with statistical estimates (e.g., mean/median for numerical data, mode for categorical).
- Flagging: Mark incomplete records for manual review (e.g., "Potential Data Quality Issue").
-
Outlier Detection:
Use z-score analysis or Interquartile Range (IQR) to identify anomalies (e.g., a $10,000 purchase in a dataset where the average is $100).IQR Formula:
\( \text{IQR} = Q3 - Q1 \)
\( \text{Lower Bound} = Q1 - 1.5 \times \text{IQR} \)
\( \text{Upper Bound} = Q3 + 1.5 \times \text{IQR} \) -
Deduplication:
Merge records with identical identifiers (e.g., email addresses) using fuzzy matching for slight variations (e.g., "john.doe@example.com" vs. "j.doe@example.com"). -
Tools and Technologies for Data Analytics in Marketing
Data analytics in marketing relies on a diverse ecosystem of tools and technologies designed to collect, process, visualize, and derive actionable insights from structured and unstructured data. These platforms range from user-friendly proprietary solutions to highly customizable open-source frameworks, each serving distinct purposes such as real-time tracking, predictive modeling, or automated reporting. The selection of tools often depends on factors like budget constraints, technical expertise, scalability requirements, and integration capabilities with existing marketing stacks. Below, the functionalities of leading analytics platforms are examined, followed by a comparative analysis of open-source versus proprietary solutions, and an exploration of how APIs facilitate seamless data synchronization across marketing tools.
Functionalities of Leading Analytics Platforms
Leading analytics platforms in marketing are categorized based on their core functionalities: web analytics, business intelligence (BI), customer data platforms (CDPs), and marketing automation. Each platform excels in specific areas, such as real-time user behavior tracking, interactive dashboards, or automated campaign optimization.Web Analytics Platforms
Web analytics tools specialize in tracking user interactions, traffic sources, and conversion metrics across websites and digital campaigns. Key functionalities include:
- Session and user behavior analysis: Heatmaps, click-path analysis, and bounce rate tracking to identify friction points in user journeys.
- Traffic source attribution: Multi-touch attribution models (e.g., linear, time-decay, position-based) to allocate credit to marketing channels accurately.
- Conversion funnel optimization: Drop-off analysis at each stage of the funnel (e.g., product page, checkout) with A/B testing capabilities.
- Event tracking: Custom event definitions (e.g., video plays, form submissions) to measure engagement beyond page views.
Example Platforms:
- Google Analytics (GA4): Dominates due to its free tier, integration with Google Ads, and advanced features like predictive metrics (e.g., churn probability, purchase probability). GA4 employs an event-based data model, allowing marketers to track user interactions across websites and apps.
- Adobe Analytics: Offers enterprise-grade capabilities, including real-time reporting, machine learning-driven insights (e.g., anomaly detection), and seamless integration with Adobe Experience Cloud for unified customer profiles.
- Matomo (formerly Piwik): An open-source alternative to Google Analytics, emphasizing data privacy (self-hosted) and compliance with GDPR. It supports custom dimensions, segmentation, and API-driven data exports.
Business Intelligence and Visualization Tools
BI tools transform raw data into interactive dashboards and reports, enabling data-driven decision-making. Their functionalities include:
- Drag-and-drop dashboard creation: Visualizations such as heatmaps, treemaps, and geographic plots to represent KPIs like customer acquisition cost (CAC) or return on ad spend (ROAS).
- Data blending: Combining data from multiple sources (e.g., CRM, ERP, social media) into a single view.
- Natural language querying (NLQ): Tools like Tableau’s "Ask Data" or Power BI’s Q&A allow non-technical users to generate insights via conversational queries.
- Automated alerts: Customizable thresholds for metrics (e.g., sudden drops in engagement) with email/SMS notifications.
Example Platforms:
- Tableau: Renowned for its design flexibility and integration with cloud data warehouses (e.g., Snowflake, BigQuery). Tableau Prep automates data cleaning and preparation workflows.
- Power BI (Microsoft): Tight integration with Microsoft 365 and Azure, along with Power Query for ETL (Extract, Transform, Load) processes. Power BI Premium offers AI-driven features like "Quick Insights."
- Looker (Google Cloud): Uses a "LookML" modeling language for scalable, collaborative data analysis, with embedded analytics for customer-facing portals.
Customer Data Platforms (CDPs)
CDPs unify first-party customer data from disparate sources (e.g., email, social media, POS systems) into a single, actionable profile. Key functionalities include:
- Identity resolution: Matching user IDs across devices and channels (e.g., email to cookie to mobile ID) to create a unified customer view.
- Segmentation and activation: Dynamic segmentation based on behavior, demographics, or predicted lifetime value (LTV), with real-time activation for personalized marketing.
- Privacy compliance: Tools like consent management and data anonymization to adhere to regulations like CCPA or GDPR.
Example Platforms:
- Segment: Focuses on event-based tracking and real-time data routing to destinations like marketing automation platforms (e.g., HubSpot, Marketo).
- Salesforce Customer 360: Combines CDP capabilities with CRM data, enabling 360-degree customer profiles and AI-driven recommendations.
- Tealium: Specializes in tag management and data governance, with features like "Customer Data Hub" for omnichannel activation.
Marketing Automation and Attribution Tools
These platforms automate repetitive tasks (e.g., email campaigns, lead scoring) and provide attribution modeling to measure campaign effectiveness. Functionalities include:
- Cross-channel campaign management: Orchestrating email, SMS, and ad campaigns with dynamic content personalization.
- Attribution modeling: Data-driven allocation of credit to touchpoints (e.g., first-click, last-click, or data-driven models like Shapley value).
- Predictive analytics: Using historical data to forecast outcomes such as churn risk or response rates.
Example Platforms:
- HubSpot: All-in-one suite for inbound marketing, with native analytics for lead tracking and ROI measurement.
- Marketo (Adobe): Enterprise-grade automation with advanced segmentation and revenue attribution.
- Attribution platforms: Tools like Adobe Attribution AI or Singular specialize in multi-touch attribution (MTA) across paid and organic channels.
Open-Source vs. Proprietary Tools: Cost, Scalability, and Learning Curves
The choice between open-source and proprietary tools hinges on organizational priorities, including budget, technical resources, and long-term scalability. Below is a comparative analysis of their trade-offs:Cost Implications
- Open-source tools (e.g., Python libraries like Pandas, R, or tools like Metabase, Superset) incur minimal direct costs, as licensing is typically free. However, indirect costs include:
- Infrastructure: Self-hosting requires servers, cloud storage, and maintenance (e.g., AWS/GCP costs for scaling).
- Custom development: Hiring data engineers or developers to build custom pipelines or integrations.
- Support: Lack of official vendor support may necessitate community forums or third-party consulting.
- Proprietary tools (e.g., Tableau, Adobe Analytics, Salesforce) offer subscription-based pricing (e.g., per-user, per-month), with costs scaling with features and user tiers. Enterprise plans may include:
- Managed services: Cloud hosting, security patches, and SLAs (Service Level Agreements).
- Training and certification: Official programs to upskill teams (e.g., Tableau Desktop Specialist).
- Vendor lock-in: Custom integrations may limit portability to other platforms.
Scalability Considerations
- Open-source tools excel in scalability for large datasets and custom workflows:
- Big data frameworks: Tools like Apache Spark (via PySpark or R’s sparklyr) or Dask enable distributed processing of terabytes of data.
- Cloud-native solutions: Open-source tools integrate seamlessly with cloud providers (e.g., AWS Athena for SQL queries on S3, Google BigQuery ML for in-database machine learning).
- Modularity: Components can be swapped or extended (e.g., replacing Pandas with Polars for faster DataFrame operations).
- Proprietary tools often provide out-of-the-box scalability but with limitations:
- Cloud-based solutions: Platforms like Power BI Premium or Tableau Server automatically scale with user load, but costs rise with usage.
- Data volume limits: Some tools (e.g., free tiers of Google Analytics) cap data retention or sampling rates for large datasets.
- Vendor-driven updates: Scalability may depend on the vendor’s roadmap (e.g., Adobe Analytics’ transition to Real-Time CDP).
Learning Curves and Skill Requirements
- Open-source tools require higher technical proficiency:
- Programming knowledge: Proficiency in Python, R, or SQL is essential for data manipulation and analysis. Libraries like Pandas (Python) or dplyr (R) demand understanding of data structures (e.g., DataFrames) and algorithms (e.g., pivoting, merging).
- DevOps skills: Self-hosted solutions necessitate familiarity with containerization (Docker), orchestration (Kubernetes), and CI/CD pipelines.
- Community reliance: Troubleshooting often depends on Stack Overflow, GitHub issues, or forums like Reddit’s r/learnpython.
- Proprietary tools prioritize user-friendliness but may still require training:
- Low-code/no-code interfaces: Tools like Power BI or Tableau offer intuitive drag-and-drop dashboards, reducing the need for coding.
- Built-in tutorials: Platforms provide guided learning paths (e.g., Google Analytics Academy, Tableau Public).
- Hidden complexity: Advanced features (e.g
Customer Segmentation and Personalization Strategies
Customer segmentation and personalization are core components of data-driven marketing, enabling brands to deliver tailored experiences that enhance engagement, conversion rates, and customer lifetime value (CLV). By leveraging behavioral, transactional, and demographic data, organizations can identify distinct customer groups and apply targeted strategies—ranging from batch-based email campaigns to real-time dynamic content adjustments. This section explores structured methodologies for segmentation, including RFM analysis, and outlines a workflow for implementing personalized campaigns, from data preparation to performance evaluation. Comparative frameworks highlight trade-offs between batch and real-time personalization, ensuring alignment with business objectives and technical capabilities.
RFM Analysis for Customer Segmentation
RFM (Recency, Frequency, Monetary) analysis is a data-driven technique to categorize customers based on their purchasing behavior, providing actionable insights for segmentation. The method evaluates three key metrics:
- Recency: Time since the last purchase (shorter intervals indicate higher engagement).
- Frequency: Number of transactions within a defined period.
- Monetary: Total spending over time (often weighted by average order value).
Customers are clustered into segments (e.g., "Champions," "At Risk," "New Customers") using statistical algorithms or rule-based thresholds. Below are SQL and Python implementations for RFM segmentation, followed by a workflow for applying these segments to marketing strategies.
SQL Implementation for RFM Calculation
WITH customer_metrics AS (
SELECT
customer_id,
MAX(order_date) AS last_purchase_date,
COUNT(order_id) AS purchase_frequency,
SUM(order_amount) AS total_spend
FROM orders
WHERE order_date >= DATEADD(year, -1, GETDATE()) -- Adjust time window
GROUP BY customer_id
),
rfm_scores AS (
SELECT
customer_id,
DATEDIFF(day, last_purchase_date, GETDATE()) AS recency_days,
purchase_frequency,
total_spend,
-- Normalize scores (1-5) for each metric
NTILE(5) OVER (ORDER BY DATEDIFF(day, last_purchase_date, GETDATE())) AS recency_score,
NTILE(5) OVER (ORDER BY purchase_frequency) AS frequency_score,
NTILE(5) OVER (ORDER BY total_spend) AS monetary_score
FROM customer_metrics
)
SELECT
customer_id,
recency_days,
purchase_frequency,
total_spend,
recency_score,
frequency_score,
monetary_score,
-- Combine scores into RFM cell (e.g., "555" for high-value customers)
CONCAT(recency_score, frequency_score, monetary_score) AS rfm_cell
FROM rfm_scores;Python Implementation with Pandas
import pandas as pd
from sklearn.preprocessing import MinMaxScaler# Load transaction data (example: customer_id, order_date, amount)
df = pd.read_csv("customer_transactions.csv")
df['order_date'] = pd.to_datetime(df['order_date'])# Calculate RFM metrics
rfm = df.groupby('customer_id').agg({
'order_date': lambda x: (pd.Timestamp.now() - x.max()).days, # Recency
'order_id': 'count', # Frequency
'amount': 'sum' # Monetary
}).rename(columns={
'order_date': 'recency',
'order_id': 'frequency',
'amount': 'monetary'
})# Normalize scores (1-5) using MinMaxScaler
scaler = MinMaxScaler()
rfm[['recency_norm', 'frequency_norm', 'monetary_norm']] = scaler.fit_transform(rfm[['recency', 'frequency', 'monetary']])
rfm[['recency_norm', 'frequency_norm', 'monetary_norm']] = rfm[['recency_norm', 'frequency_norm', 'monetary_norm']].mul(5).round().astype(int)# Assign RFM segments (example: 5=high, 1=low)
rfm['rfm_cell'] = rfm[['recency_norm', 'frequency_norm', 'monetary_norm']].apply(lambda x: ''.join(x.astype(str)), axis=1)Segmentation Framework
Customers are categorized into predefined groups based on RFM scores:
- Champions (555): High-value, loyal customers (target for retention programs).
- At Risk (144): Recently inactive but historically high spenders (win-back campaigns).
- New Customers (111): First-time buyers (onboarding sequences).
- Lost (111): Low recency/frequency (churn risk).
- Potential Loyalists (155): Moderate spenders with high frequency (upsell opportunities).
Visual Representation of RFM Clusters
A 3D scatter plot (Recency vs. Frequency vs. Monetary) or a Venn diagram overlaying behavioral attributes (e.g., browsing history) can illustrate how RFM segments map to engagement tiers. For example:
- High-Monetary/Low-Frequency: Target with high-value promotions.
- High-Frequency/Low-Monetary: Bundle products to increase average order value (AOV).
Workflow for Implementing Personalized Marketing Campaigns
Personalization requires a structured workflow integrating data, technology, and execution. Below is a step-by-step process from segmentation to A/B testing, with emphasis on scalability and measurability.1. Data Collection and Integration
- Sources: CRM (e.g., Salesforce), web analytics (Google Analytics), transactional databases, and third-party data (e.g., demographic overlays).
- Tools: ETL pipelines (e.g., Apache NiFi, Talend) or cloud-based solutions (AWS Glue, Google Dataflow) to unify data.
- Key Metrics: RFM scores, browsing behavior (clickstream data), email open rates, and social media interactions.
2. Customer Segmentation and Profiling
- Apply RFM or advanced clustering (e.g., k-means, DBSCAN) to identify homogeneous groups.
- Enrich segments with behavioral data (e.g., product views, cart abandonment) using tools like Segment.com or Klaviyo.
- Example: A "Tech Enthusiasts" segment may combine RFM scores with device usage patterns (e.g., frequent visits to laptop product pages).
3. Content and Offer Personalization
- Dynamic Content: Use templates with conditional logic (e.g., HubSpot, Braze) to display tailored product recommendations.
- Example: Show "Limited-Time Offer" to "At Risk" segments in email subject lines.
- Product Recommendations: Collaborative filtering (e.g., "Customers who bought X also bought Y") or content-based filtering (user preferences).
- Visual Mapping: A flowchart can depict how behavioral triggers (e.g., abandoned cart) route users to personalized landing pages.
4. Channel-Specific Execution
5. A/B Testing and OptimizationChannel Personalization Method Tools Email Subject lines, product recommendations Mailchimp, Klaviyo Website Dynamic content blocks, exit-intent popups Optimizely, Dynamic Yield Social Media Ad targeting, retargeting audiences Meta Ads Manager, LinkedIn Ads SMS Location-based offers, urgency triggers Twilio, Attentive
- Hypothesis Testing: Compare conversion rates between personalized and generic campaigns (e.g., 20% vs. 12% for RFM-targeted emails).
- Tools: Google Optimize, VWO, or built-in A/B testing in marketing automation platforms.
- Metrics: Click-through rate (CTR), conversion rate, revenue per customer (RPC), and unsubscribe rates.
- Iteration: Use results to refine segments (e.g., split "Champions" into "High-Spend Champions" and "Loyalty Champions").
Example Workflow Diagram
[Data Collection] → [Segmentation (RFM/Clustering)]
↓
[Profile Enrichment] → [Content/Offer Design]
↓
[Channel Deployment] → [A/B Testing]
↓
[Performance Analysis] → [Segment Refinement]
Batch vs. Real-Time Personalization: Comparative Framework
Personalization strategies vary in latency, complexity, and impact. Below is a table contrasting batch and real-time approaches, including use cases and trade-offs.
Criteria Batch Personalization Real-Time Personalization Definition Pre-computed, scheduled (e.g., weekly emails). Instantaneous adjustments (e.g., website content). Data Latency Hours/days (historical data). Milliseconds (live interactions). Tools/Technologies SQL, Python (Pandas), Marketing Automation (HubSpot). CDP (Customer Data Platforms), JavaScript (e.g., Google Tag Manager), Edge Computing. 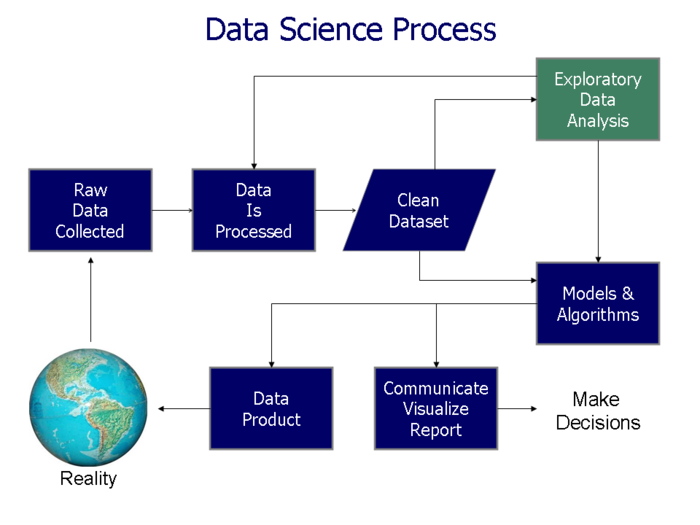
Predictive and Prescriptive Analytics in Marketing
Predictive and prescriptive analytics transform raw marketing data into actionable insights, enabling businesses to anticipate trends, optimize resource allocation, and enhance customer engagement. While predictive analytics leverages historical and real-time data to forecast future outcomes—such as sales volumes or churn rates—prescriptive analytics extends this by recommending optimal strategies, such as budget allocation or ad spend distribution. These methodologies bridge the gap between data-driven forecasts and tactical decision-making, ensuring marketing efforts align with measurable business objectives.The integration of time-series forecasting models (e.g., ARIMA, Prophet) and optimization algorithms (e.g., linear programming, decision trees) provides a robust framework for marketing analytics. Below, the discussion explores time-series forecasting for sales and churn prediction, prescriptive techniques for resource optimization, and a case study demonstrating the end-to-end application of predictive models in lead scoring. A comparative table further clarifies the distinctions between predictive and prescriptive approaches, highlighting their respective use cases, data requirements, and tools.
Time-Series Forecasting for Sales and Customer Churn
Time-series forecasting models analyze sequential data points to predict future trends, making them indispensable for marketing scenarios where historical patterns influence outcomes. In sales forecasting, these models estimate demand fluctuations, enabling inventory management and promotional planning. For customer churn, time-series analysis identifies at-risk segments by detecting behavioral shifts (e.g., reduced purchase frequency) before attrition occurs.Key Models and Applications
Time-series forecasting relies on statistical and machine learning techniques, with ARIMA (AutoRegressive Integrated Moving Average) and Facebook’s Prophet being among the most widely adopted. ARIMA decomposes data into trend, seasonality, and residual components, while Prophet incorporates additive or multiplicative seasonality and holiday effects, making it robust for business cycles. Below are implementations for sales forecasting and churn prediction using Python and sample datasets.Sales Forecasting with ARIMA
ARIMA is suited for univariate time-series data where the target variable (e.g., monthly sales) depends on its own lagged values. The model requires stationarity, achieved through differencing or transformations. For example, forecasting monthly sales for an e-commerce retailer:from statsmodels.tsa.arima.model import ARIMA
import pandas as pd# Sample dataset: Monthly sales (2020-2023)
data = {
'Month': pd.date_range(start='2020-01-01', periods=48, freq='M'),
'Sales': [120, 135, 140, 150, 160, 170, 180, 190, 200, 210,
220, 230, 240, 250, 260, 270, 280, 290, 300, 310,
320, 330, 340, 350, 360, 370, 380, 390, 400, 410,
420, 430, 440, 450, 460, 470, 480, 490, 500, 510,
520, 530, 540, 550, 560, 570, 580, 590, 600, 610,
620, 630, 640, 650]
}
df = pd.DataFrame(data)
model = ARIMA(df['Sales'], order=(1, 1, 1)) # (p, d, q)
results = model.fit()
forecast = results.forecast(steps=12) # Predict next 12 monthsOutput Interpretation: The forecasted values (e.g., `[660, 675, 690, ...]`) indicate expected sales, with confidence intervals derived from residuals. Seasonal adjustments (e.g., holiday spikes) can be incorporated via SARIMA (Seasonal ARIMA).
Customer Churn Prediction with Prophet
Prophet handles missing data and outliers better than ARIMA, making it ideal for churn analysis where customer behavior may exhibit irregular patterns. For a subscription-based service:from prophet import Prophet
import numpy as np# Sample dataset: Monthly active users (MAU) and churned users
data = {
'ds': pd.date_range(start='2020-01-01', periods=48, freq='M'),
'y': [1000, 1050, 1100, 1150, 1200, 1250, 1300, 1350, 1400, 1450,
1500, 1550, 1600, 1650, 1700, 1750, 1800, 1850, 1900, 1950,
2000, 2050, 2100, 2150, 2200, 2250, 2300, 2350, 2400, 2450,
2500, 2550, 2600, 2650, 2700, 2750, 2800, 2850, 2900, 2950,
3000, 3050, 3100, 3150, 3200, 3250, 3300, 3350, 3400, 3450]
}
df_prophet = pd.DataFrame(data)
model = Prophet(seasonality_mode='multiplicative', yearly_seasonality=True)
model.fit(df_prophet)
future = model.make_future_dataframe(periods=12)
forecast = model.predict(future)
churn_rate = (df_prophet['y'].diff().fillna(0) < 0).mean() # Baseline churn rateKey Metrics:
- Mean Absolute Error (MAE): Average absolute difference between predicted and actual churn.
- Root Mean Squared Error (RMSE): Penalizes larger errors, useful for skewed distributions.
- Churn Cohorts: Segment users by tenure (e.g., 0–3 months, 3–6 months) to identify high-risk periods.
Prescriptive Analytics for Marketing Budget Allocation
Prescriptive analytics optimizes marketing strategies by evaluating trade-offs between objectives (e.g., maximizing ROI while minimizing cost). Techniques such as linear programming, integer programming, and decision trees allocate budgets across channels (e.g., SEO, PPC, social media) based on historical performance and business constraints. Unlike predictive models, which forecast outcomes, prescriptive analytics recommends optimal actions given predefined goals.Optimization Algorithms for Ad Spend Allocation
Linear programming (LP) solves for the optimal distribution of a limited budget to maximize a linear objective (e.g., conversions) subject to constraints (e.g., channel spend limits). For example, allocating a $10,000 monthly budget across Google Ads, Facebook Ads, and email marketing:from scipy.optimize import linprog
# Objective: Maximize conversions (coefficients per $1,000 spent)
c = [-20, -15, -10] # Negative for maximization
Constraints: A_ub x <= b_ub
A = [[1, 1, 1]] # Total budget constraint
b = [10] # $10,000 (scaled to $10 for simplicity)
Bounds: Each channel must spend at least $1,000
x_bounds = [(1, None), (1, None), (1, None)]
result = linprog(c, A_ub=A, b_ub=b, bounds=x_bounds, method='highs')
optimal_spend = result.x 1000 # Scale back to dollarsOutput: `optimal_spend` returns `[4000, 3000, 3000]`, indicating $4,000 for Google Ads, $3,000 for Facebook, and $3,000 for email, assuming conversion rates of 20, 15, and 10 per $1,000, respectively.
Decision Trees for Channel Prioritization
Decision trees classify channels based on performance metrics (e.g., CAC, LTV) and recommend allocations. For instance, a tree trained on historical data might prioritize channels with:
- High Conversion Rate (
Ethics, Privacy, and Compliance in Data-Driven Marketing
Data-driven marketing leverages customer data to deliver personalized experiences, optimize campaigns, and enhance decision-making. However, this reliance on data introduces significant ethical, legal, and compliance challenges. Regulatory frameworks such as the General Data Protection Regulation (GDPR) and the California Consumer Privacy Act (CCPA) impose strict requirements on data collection, processing, storage, and sharing. Ethical dilemmas further complicate implementation, particularly in areas like microtargeting, dark patterns, and consent management. Organizations must adopt proactive compliance strategies, including anonymization techniques, audit protocols, and transparent communication frameworks, to mitigate risks while maintaining trust and operational integrity.The following sections outline regulatory obligations, technical safeguards, and practical guidelines for ensuring ethical and compliant data usage in marketing analytics.
Regulatory Frameworks Governing Customer Data Usage
Global and regional laws establish binding requirements for data handling in marketing. Key regulations include:- GDPR (EU/EEA): Mandates explicit consent, data minimization, and individual rights (e.g., access, deletion, portability). Article 6 justifies processing via legitimate interest or consent, while Article 9 restricts sensitive data (e.g., racial origin, health). Article 32 requires security measures proportional to risks.
- CCPA (California, USA): Grants consumers rights to know, delete, and opt out of data sales. CCPA’s "Do Not Sell My Personal Information" (DNMSPI) mechanism requires clear opt-out pathways.
- LGPD (Brazil): Aligns with GDPR principles but includes stricter penalties for non-compliance, emphasizing data subject control and cross-border transfers.
- Sector-Specific Laws: Examples include HIPAA (Healthcare, USA) and COPPA (Children’s Data, USA), which impose additional restrictions on vulnerable groups.
Key Principle: Data processing must align with lawfulness, fairness, and transparency (GDPR Article 5). Organizations bear responsibility for demonstrating compliance via documentation and audits.
Anonymization and Pseudonymization Techniques
To comply with privacy laws and reduce re-identification risks, organizations employ anonymization (irreversible data transformation) and pseudonymization (reversible with a key). Techniques include:- k-Anonymity: Ensures each record matches at least k other records on quasi-identifiers (e.g., age, ZIP code). Example: A dataset with k=3 prevents singling out individuals even if external data is combined.
- Differential Privacy: Adds statistical noise to queries to prevent inference of individual data points. Used by Google and Apple for aggregate analytics.
- Tokenization: Replaces sensitive data (e.g., email addresses) with non-sensitive tokens, stored separately from encryption keys.
- Generalization: Aggregates data into broader categories (e.g., "Age Group: 25–34" instead of exact birthdates).
Best Practice: Combine pseudonymization for operational use with anonymization for archival or public datasets to balance utility and privacy.
Implementation Challenges:
- Trade-offs: Stronger anonymization reduces analytical value (e.g., k-anonymity may obscure trends).
- Dynamic Data: Updates to datasets (e.g., new transactions) can invalidate anonymized states.
- Third-Party Risks: Vendors may re-identify data if not properly anonymized.
Consent Management Protocols
Explicit, informed consent is a cornerstone of GDPR and CCPA compliance. Effective protocols include:- Granular Consent: Allow users to opt in/out for specific purposes (e.g., "marketing emails" vs. "personalization"). Example: IAB’s Transparency & Consent Framework (TCF) for digital advertising.
- Double Opt-In: Requires users to confirm consent via a secondary action (e.g., email verification) to prevent fraudulent submissions.
- Consent Decay: Regularly review and refresh consent (e.g., annually) to reflect evolving preferences.
- Layered Consent: Present options in tiers (e.g., "Basic" vs. "Enhanced" tracking) with clear explanations of data usage.
Technical Requirements:
- Consent Logs: Maintain timestamped records of consent/withdrawal actions for audit trails.
- User-Friendly Interfaces: Avoid "consent fatigue" with concise, jargon-free language. Example:
> "We use cookies to personalize ads. [Accept] [Reject] [Learn More]"- Global Consistency: Ensure consent mechanisms adapt to regional laws (e.g., GDPR’s "clear and plain language" vs. CCPA’s "Do Not Sell" toggle).
Critical Note: Silence, inactivity, or pre-ticked boxes do not constitute valid consent (GDPR Recital 32).
Step-by-Step Guide to Auditing Marketing Data Pipelines
Audits identify compliance gaps and vulnerabilities in data flows. Follow this structured approach:1. Scope Definition
- Map all data sources (e.g., CRM, website trackers, third-party APIs) and destinations (e.g., analytics platforms, ad networks).
- Include customer-facing (e.g., cookies, forms) and internal (e.g., employee access logs) data touchpoints.
2. Data Inventory
- Catalog data types (e.g., PII, behavioral, transactional) and their purposes (e.g., segmentation, retargeting).
- Example inventory table:
3. Consent and Legality ReviewData Type Source Purpose Retention Period Legal Basis Email Address Lead Form Marketing Campaigns 3 Years Legitimate Interest Purchase History E-Commerce Platform Personalization 5 Years Contract Fulfillment IP Address Website Logs Fraud Detection 1 Year Legal Obligation
- Verify consent mechanisms align with GDPR’s six lawful bases (e.g., consent, contract) and CCPA’s "business purpose" exemption.
- Cross-check with privacy policies to ensure transparency.
4. Third-Party Vendor Assessment
- Evaluate vendors (e.g., Google Analytics, Salesforce) using a Data Processing Agreement (DPA) checklist:
- Do they provide subprocessor transparency?
- Can they delete data upon request?
- Do they support cross-border transfers (e.g., EU-US Data Privacy Framework)?
- Example red flags: Vendors refusing to sign DPAs or using dark patterns (e.g., hidden consent forms).
5. Technical Safeguards Audit
- Encryption: Ensure data at rest (databases) and in transit (APIs) use AES-256 or equivalent.
- Access Controls: Implement role-based access (RBAC) and multi-factor authentication (MFA) for sensitive data.
- Data Minimization: Delete unused fields (e.g., social security numbers in marketing databases).
6. Retention Policy Validation
- Align retention periods with legal holds (e.g., tax records) and business needs (e.g., customer support).
- Example policy:
- PII: Retain for 3 years post-interaction unless legally required longer.
- Transaction Data: Archive for 7 years for audits.
7. Incident Response Plan
- Define breach notification timelines (GDPR: 72 hours; CCPA: 30 days).
- Include root cause analysis and corrective actions in audit reports.
Audit Checklist:
- [ ] All data flows are documented and mapped.
- [ ] Consent is granular, recorded, and revocable.
- [ ] Third-party vendors comply with GDPR/CCPA via signed DPAs.
- [ ] Retention policies are enforced via automated deletion workflows.
- [ ] Employees undergo privacy-by-design training.
- Resolution Framework: 1. Transparency: Disclose targeting criteria (e.g., "Ads based on browsing history").
- Structured Data: User watch history, ratings, demographics (stored in Hadoop and Cassandra).
- Unstructured Data: Transcripts (via NLP pipelines), social media trends, and implicit signals (e.g., pause/rewind behavior).
- Tools:
- Matrix Factorization (for collaborative filtering) implemented in Spark MLlib.
- Deep Learning (e.g., Wide & Deep models) for hybrid recommendations.
- A/B Testing Platforms (e.g., Optimizely) to validate algorithmic changes.
- Business Impact: 80% of content consumption driven by recommendations (Netflix Tech Blog, 2020), contributing to a 20% increase in user retention.
- Scalability: Modular architecture allows real-time updates (e.g., Kafka for streaming data) and global personalization.
-
Sentiment Analysis
- Use Case: Coca-Cola’s #ShareACoke campaign monitored Twitter/X for real-time sentiment shifts (positive/negative/neutral) using VADER or BERT-based models.
- Outcome: Adjusted messaging in regions with low engagement (e.g., Japan) by identifying cultural nuances in reviews.
-
Topic Modeling (LDA/NMF)
- Use Case: Sephora’s YouTube comment analysis to detect trending skincare topics (e.g., "vitamin C serums") via Latent Dirichlet Allocation (LDA).
- Outcome: Launched targeted influencer collaborations and product bundles, increasing search-to-purchase conversion by 15%.
-
Entity Recognition (NER)
- Use Case: Amazon’s product review analysis to extract brand mentions (e.g., "Kindle vs. Nook") and competitor weaknesses.
- Outcome: Dynamic pricing adjustments and sponsored content placements in high-competition categories.
- Data Ingestion: Apache NiFi or AWS Kinesis for real-time social media streams.
- Processing: Python (spaCy, NLTK) or R (tidytext) for NLP pipelines.
- Visualization: Tableau or Looker to correlate sentiment trends with sales data.
- Automation: Zapier or Airflow to trigger marketing actions (e.g., discount codes for negative reviews).
- Clickstream data (Google Analytics 4).
- Transaction logs (e.g., cart abandonment rates).
- Social proof (reviews, UGC).
- CRM data (Salesforce, HubSpot).
- Email engagement (open rates, CTAs).
- Third-party firmographics (Dun & Bradstreet).
- Data Volume: Handling terabytes of session data requires distributed computing (Spark, Flink).
- Fraud Detection: Anomaly detection (e.g., Isolation Forest) for chargebacks.
- Dynamic Pricing: Requires reinforcement learning for real-time adjustments.
- Data Sparsity: Fewer transactions per lead necessitate graph analytics (Neo4j) to map buyer journeys.
- Attribution Complexity: Multi-touch attribution (RITA model) vs. last-click bias.
- Regulatory Compliance: GDPR/CCPA impacts data anonymization (e.g., differential privacy).
- Amazon: Uses DeepAR for demand forecasting and Personalize for recommendations.
- Shopify: Leverages Shopify Flow for automated discount triggers based on cart value.
- Salesforce: Einstein AI for predictive lead scoring and Tableau CRM for sales pipeline visualization.
- HubSpot: Marketing Hub’s predictive lead scoring using XGBoost models.
- Objective: Decrease cart abandonment from 68% to <50% within 6 months.
- Stakeholders:
- Marketing Team: Defines KPIs (e.g., open rates, CTR).
- Data Science: Identifies data gaps (e.g., lack of real-time behavioral triggers).
- Tech: Ensures API compatibility with Klaviyo (email platform) and Segment (CDP).
- Tools:
- Jira/
The intersection of data analytics and marketing represents more than a technological advancement; it is a fundamental reimagining of how brands connect with their audiences. By adopting data-driven frameworks, organizations can move beyond reactive campaign adjustments to proactive, evidence-based strategies that align with ethical standards and regulatory demands. The future belongs to those who not only harness the power of data but also refine it into actionable intelligence—balancing innovation with responsibility to deliver measurable impact without compromising trust. This evolution demands continuous learning, adaptability, and a commitment to leveraging analytics as both a tool and a strategic compass.
Ethical Dilemmas in Marketing Analytics and Resolution Frameworks
Data-driven marketing often clashes with ethical principles, creating dilemmas such as:- Microtargeting: Using granular data to influence vulnerable groups (e.g., political ads targeting mental health crises). Risk: Exploitative manipulation.
2. Bias Mitigation: Audit algorithms for discriminatory outcomes (e.g., excluding low-income users).
3. Ethical Review Boards: Independent oversight for high-stakes
Case Studies and Real-World Applications in Marketing Analytics
Marketing analytics transforms theoretical strategies into actionable insights through empirical evidence, demonstrating measurable impact across industries. Real-world applications reveal how organizations integrate data-driven methodologies—from recommendation engines to sentiment analysis—to optimize customer engagement, operational efficiency, and revenue growth. This section dissects frameworks, tools, and outcomes of high-profile case studies, explores the extraction of value from unstructured data, compares industry-specific challenges, and outlines an end-to-end Agile project workflow for marketing analytics initiatives.Framework for Analyzing Marketing Analytics Success Stories
A structured approach to dissecting case studies ensures reproducibility and scalability of insights. The 5-P Framework (Problem, Process, Platform, People, Performance) provides a systematic lens to evaluate marketing analytics initiatives, as applied to Netflix’s recommendation engine and similar high-impact examples.5-P Framework Components:Data Sources and Tools in Netflix’s Recommendation Engine
1. Problem: Business objective (e.g., reducing churn, increasing watch time).
2. Process: Data collection, cleaning, and modeling methodologies.
3. Platform: Tools and technologies (e.g., SQL, Python, TensorFlow).
4. People: Roles (data scientists, marketers, engineers) and collaboration models.
5. Performance: Metrics (e.g., conversion lift, ROI) and qualitative feedback.
Netflix’s success hinges on multi-modal data integration, combining:
Outcomes and Scalability
Leveraging Unstructured Data for Marketing Strategy Refinement
Unstructured data—such as social media posts, customer reviews, and support tickets—offers granular insights into consumer sentiment, emerging trends, and pain points. Text-processing techniques, particularly Natural Language Processing (NLP), enable brands to automate strategy adjustments without manual analysis.Text-Processing Techniques and Applications
Comparative Analysis: E-Commerce vs. B2B Data Analytics Challenges
While both sectors rely on data analytics, their objectives, data availability, and customer journeys introduce distinct challenges and solutions. A comparative breakdown highlights industry-specific optimizations.| Dimension | E-Commerce (e.g., Amazon, Shopify) | B2B (e.g., Salesforce, HubSpot) |
|---|---|---|
| Primary Objective | Mass personalization, real-time inventory optimization, and impulse purchases. | Lead nurturing, sales cycle acceleration, and ROI attribution over long horizons. |
| Key Data Sources | ||
| Unique Challenges | ||
| Solution Highlights |
Both sectors benefit from unified data platforms (e.g., Snowflake, Databricks) to consolidate disparate sources. However, B2B analytics prioritizes explainability (e.g., SHAP values for feature importance) due to stakeholder scrutiny, while e-commerce emphasizes latency (e.g., sub-second recommendation responses).
Hypothetical Marketing Analytics Project: Agile Workflow from Problem Definition to Deployment
An Agile-driven marketing analytics project for a D2C (Direct-to-Consumer) skincare brand illustrates iterative development, stakeholder collaboration, and measurable outcomes. The project focuses on reducing cart abandonment through dynamic email personalization.Phase 1: Problem Definition and Sprint 0
FAQ
What is a data analytics and marketing course, and what skills does it teach?
A data analytics and marketing course combines training in statistical analysis, data visualization, and marketing strategies to help professionals extract insights from customer data. Topics typically include SQL, Python/R for data processing, digital marketing metrics (e.g., ROI, CTR), A/B testing, and tools like Google Analytics or Tableau. Many courses are offered online (e.g., Coursera, Udemy) or through universities as certificates or degrees, catering to beginners and marketers looking to upskill.
What types of jobs are available in data analytics and marketing, and what do they pay?
Jobs in this field include Marketing Data Analyst (salary: $60K–$90K), Digital Marketing Analyst ($55K–$85K), Customer Analytics Manager ($80K–$120K), and Marketing Operations Analyst ($70K–$100K). Roles often require SQL, Excel, and marketing tools (e.g., HubSpot, Adobe Analytics). Entry-level positions may focus on reporting, while senior roles involve strategy, segmentation, and predictive modeling. Salaries vary by location, industry (tech pays more), and experience.
How does data science intersect with marketing, and what are key applications?
Data science in marketing leverages machine learning, AI, and statistical modeling to personalize campaigns, optimize spend, and predict customer behavior. Key applications include predictive analytics (churn risk, lead scoring), recommendation engines (e.g., Netflix, Amazon), dynamic pricing, and automated ad targeting (e.g., Facebook’s AI). Tools like Python (scikit-learn), R, and platforms like Google BigQuery enable marketers to analyze large datasets for actionable insights.
What does a data analyst in marketing do, and what tools do they use?
A data analyst in marketing collects, processes, and interprets data to measure campaign performance, customer behavior, and business impact. Their tasks include tracking KPIs (e.g., conversion rates, customer lifetime value), conducting A/B tests, and creating dashboards (e.g., Google Data Studio). Common tools are SQL (data extraction), Excel/Google Sheets (basic analysis), Python/R (advanced modeling), and marketing platforms (e.g., Salesforce, Mailchimp).
How can data analysis improve marketing strategies and ROI?
Data analysis helps marketers refine strategies by identifying high-performing channels (e.g., email vs. social media), optimizing ad spend through attribution modeling, and segmenting audiences for personalized messaging. It also enables real-time adjustments (e.g., pausing underperforming ads) and forecasting demand to align inventory or promotions. Companies using data-driven marketing see 5–20% higher ROI and better customer retention, according to McKinsey.
What are the most in-demand jobs for data analysts in marketing, and how do I get hired?
In-demand roles include Marketing Analyst, Customer Insights Analyst, Growth Analyst, and Marketing Data Scientist. To land these jobs, build skills in SQL, Excel, and marketing tools (e.g., Google Analytics, Adobe Analytics), earn certifications (Google Data Analytics, HubSpot), and gain experience with A/B testing or customer segmentation. Networking on LinkedIn and tailoring your resume to highlight business impact (e.g., "increased conversions by X%") improves hiring chances.
Leave a Comment
Comments are moderated before appearing. The data you submit is processed according to the Privacy Policy of viralcontentbee.com.