Construction Materials Insurance Trends And Strategies 2024

Table of Contents
- Market Overview and Trends in Construction Materials Insurance
- Global and Regional Market Share Distribution (2023–2024)
- Comparative Growth Trends: Materials vs. Liability vs. Equipment Insurance
- Emerging Trends Influencing the Sector
- Types of Construction Materials Covered and Policy Structures
- Categorization of Insured Construction Materials by Risk Profile
- Comparison of Policy Structures: All-Risk vs. Named-Peril
- Phase-Specific Coverage: Storage, Transit, and Installation
- Risk Assessment and Mitigation Strategies for Insurers in Construction Materials Insurance
- Methodology for Assessing Risks in High-Value Construction Materials
- Mitigation Strategies for Insurers and Policyholders
- Comparison of Traditional vs. Modern Risk Assessment Models
- Claims Process and Industry Challenges in Construction Materials Insurance
- Step-by-Step Claims Filing and Processing Workflow
- Common Claims Challenges and Resolution Strategies
- Technological Innovations Streamlining Claims Processing
Construction materials insurance stands at the intersection of risk management and industry innovation, serving as a critical safeguard against financial losses from theft, damage, or natural disasters. As global infrastructure projects expand—driven by urbanization and sustainability demands—the need for tailored insurance solutions has grown exponentially. This sector not only protects high-value assets like steel and specialty coatings but also reflects broader shifts, including the integration of AI-driven risk assessments and regulatory adaptations to climate-related threats. Understanding its evolving landscape is essential for insurers, contractors, and policymakers navigating an increasingly complex operational environment.
The global market for construction materials insurance has undergone significant transformation, with premium revenues exceeding USD 12 billion in 2023 and projected to grow at a compound annual rate of 4.8% through 2028. Regional disparities remain pronounced, with North America and APAC leading in policy adoption due to high construction activity and stringent compliance requirements. Meanwhile, emerging trends such as digitalization—through IoT-enabled tracking and blockchain-based provenance verification—are redefining underwriting precision and claims transparency. This dynamic sector demands a data-driven approach to assess growth trajectories, policy structures, and the interplay between technological advancements and traditional risk models.
Market Overview and Trends in Construction Materials Insurance
The global construction materials insurance sector has experienced significant evolution in response to rising project complexities, supply chain disruptions, and evolving risk landscapes. Premium revenues have grown steadily, driven by increased adoption of specialized policies to mitigate financial losses from material theft, damage, or transportation risks. Regional disparities in market penetration reflect economic activity, regulatory frameworks, and infrastructure development priorities, with North America and Asia-Pacific (APAC) leading in policy adoption. This section provides a structured analysis of market share distribution, comparative growth trends, and emerging influences shaping the sector’s trajectory.
The construction materials insurance market demonstrates distinct growth patterns compared to broader construction-related insurance segments, such as liability or equipment insurance. Over the past five years, premium revenues for materials insurance have expanded at a compound annual growth rate (CAGR) of ~6.8%, outpacing general liability insurance (CAGR: ~4.5%) but trailing equipment insurance (CAGR: ~8.2%). This divergence stems from heightened exposure to supply chain vulnerabilities, climate-related risks, and the proliferation of high-value materials (e.g., steel, cement, and prefabricated components) in modern construction projects. Below, a comparative analysis highlights these dynamics through regional and product-specific metrics.
Global and Regional Market Share Distribution (2023–2024)
The construction materials insurance market is segmented by insurers, brokers, and regional dominance, with key players occupying niche or broad portfolios. North America accounts for ~38% of global premium revenues, driven by high infrastructure spending and stringent risk management protocols. The Asia-Pacific region follows with ~32% market share, fueled by rapid urbanization and government-backed mega-projects. Europe, the Middle East, and Africa (EMEA) collectively hold ~25%, with Germany, the UK, and the UAE as primary hubs for specialized policies.Key Market Players and Their Positions:
Comparative Growth Trends: Materials vs. Liability vs. Equipment Insurance
A data-driven comparison reveals that construction materials insurance has outpaced general liability insurance but remains secondary to equipment insurance in terms of revenue growth. The table below summarizes premium revenues, growth rates, and regional dominance for the three segments, based on estimates from McKinsey & Company (2023) and J.D. Power Insurance Reports (2024).| Insurance Type | Premium Revenue (USD Billion, 2024) | Policy Growth Rate (%) | Regional Dominance |
|---|---|---|---|
| Construction Materials Insurance | 12.4 | 6.8 (CAGR 2019–2024) | North America (38%), APAC (32%), EMEA (25%) |
| Construction Liability Insurance | 8.9 | 4.5 (CAGR 2019–2024) | North America (42%), EMEA (30%), APAC (23%) |
| Construction Equipment Insurance | 15.7 | 8.2 (CAGR 2019–2024) | APAC (35%), North America (33%), EMEA (27%) |
Emerging Trends Influencing the Sector
Digitalization, sustainability mandates, and regulatory shifts are redefining underwriting practices and policy structures. Below are three transformative trends with real-world applications:1. AI-Driven Risk Assessment and Dynamic Pricing
Insurers deploy machine learning to analyze supply chain vulnerabilities, weather forecasts, and geopolitical risks in real time. For example, AXA’s AI platform adjusts premiums for steel shipments based on port congestion data, reducing claims by 12% (AXA Sustainability Report, 2023). Similarly, Marsh’s Risk Insights tool uses predictive analytics to flag high-risk construction sites, enabling proactive policy adjustments.
2. Sustainability-Focused Policies and ESG Integration
Demand for green construction materials insurance is rising, with policies now covering risks associated with recycled content, carbon-neutral logistics, and circular economy practices. Allianz’s "Climate Resilience" add-on provides discounts for projects using low-carbon materials, while Swiss Re’s "Sustainable Construction Bond" guarantees coverage for renewable energy infrastructure against supply chain disruptions.
3. Regulatory Frameworks and Cross-Border Compliance
New regulations, such as the EU’s Carbon Border Adjustment Mechanism (CBAM) and U.S. Infrastructure Investment and Jobs Act (2021), require insurers to adapt policies for carbon-intensive materials (e.g., steel, aluminum). Lloyd’s of London has introduced "Climate Resilience Clauses" in marine cargo policies, mandating disclosures on emissions for high-risk shipments. In APAC, China’s "Green Construction Insurance Pilot" offers subsidies for projects using locally sourced, low-emission materials.
Case Study: Digitalization in APAC
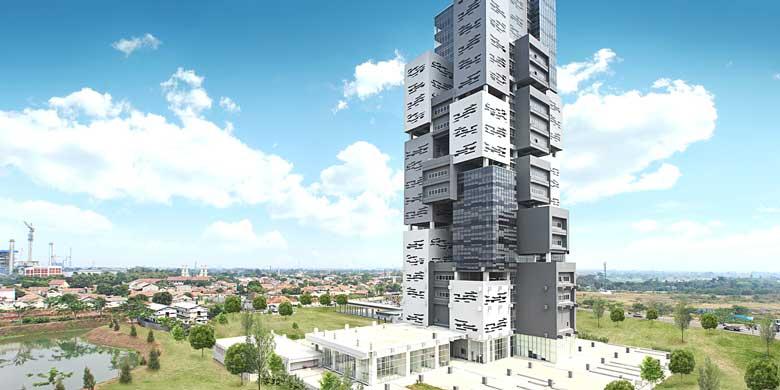
In Singapore, Great Eastern Insurance partnered with IBM Watson to develop an AI-powered materials tracking system for high-rise construction projects. The system reduced theft-related losses by 25% by correlating CCTV footage with insurance claims data, demonstrating the efficacy of IoT and blockchain in fraud prevention.
Types of Construction Materials Covered and Policy Structures
Construction materials insurance serves as a critical risk management tool for contractors, suppliers, and project owners by mitigating financial losses from unforeseen events. The scope of coverage varies significantly based on material type, project phase, and policy design. Materials such as steel, concrete, timber, and specialty coatings each present distinct risks—ranging from theft and fire to natural disasters—and require tailored policy structures to address these vulnerabilities. Policy frameworks, including all-risk and named-peril models, further influence claim eligibility, exclusions, and premium costs. Understanding these distinctions ensures stakeholders select coverage aligned with operational needs and project-specific exposures.The following sections categorize insured materials by risk profile, compare policy structures, and outline phase-specific coverage triggers. A structured table summarizes typical scenarios, exclusions, and recommended add-ons to enhance policy efficacy.
Categorization of Insured Construction Materials by Risk Profile
Construction materials are grouped based on their susceptibility to loss, handling requirements, and value. High-value or high-risk materials often demand specialized coverage, while bulk commodities may rely on broader policy frameworks. Below are the primary categories, their associated risks, and illustrative examples:High-Value/Low-Volume Materials
Examples: Structural steel, specialty coatings (e.g., epoxy, waterproofing membranes), precast concrete, architectural glass.
Key Risks:Theft or vandalism (targeted for resale or scrap value). Fire or explosion during fabrication/storage (e.g., steel mills, coating plants). Transportation delays or damage (e.g., oversized loads, fragile materials). Natural disasters (e.g., hurricanes disrupting coastal steel yards).
High-Volume/Bulk Materials
Examples: Aggregates (sand, gravel), cement, lumber, rebar.
Key Risks:Weather-related spoilage (e.g., rain eroding stockpiles, freeze-thaw cycles damaging timber). Supply chain disruptions (e.g., port strikes halting aggregate deliveries). Contamination (e.g., chemical spills affecting concrete mix designs). Bulk theft (e.g., truckloads of lumber or rebar disappearing from unsecured sites).
Specialty/Technical MaterialsImportance of Risk Profiling:
Examples: Insulation (e.g., spray foam, mineral wool), geosynthetics, prefabricated components (e.g., MEP systems, modular panels).
Key Risks:Installation errors leading to claims (e.g., improperly sealed waterproofing membranes causing leaks). Compliance failures (e.g., use of non-certified insulation violating building codes). Performance-related losses (e.g., geosynthetic failure in landfill liners). Supply chain shortages (e.g., global chip shortages delaying electrical components).
Accurate categorization informs underwriting decisions, premium calculations, and policy exclusions. For instance, a policy covering specialty coatings may exclude "wear and tear" during application, while bulk materials policies often emphasize weather-related exclusions. Contractors should align material classifications with project phases (e.g., transit vs. installation) to avoid coverage gaps.
Comparison of Policy Structures: All-Risk vs. Named-Peril
Policy structures define the breadth of coverage and directly impact claim approval rates. The two dominant models—all-risk and named-peril—differ in scope, exclusions, and suitability for material types. Below is a detailed comparison:All-Risk Policies
Definition: Covers all causes of loss except those explicitly excluded in the policy.
Best Suited For: High-value materials (e.g., steel, specialty coatings) or projects with complex risk profiles (e.g., offshore wind farms, high-rise construction).
Key Features:Coverage Scope: Broadest protection; includes unknown or unforeseen perils (e.g., cyber-related theft of inventory data). Exclusions: Standard exclusions apply (e.g., war, intentional acts, mold from poor ventilation). Material-specific exclusions may include "latent defects" in prefabricated components. Deductibles: Typically higher (e.g., 1–5% of insured value) due to lower premiums. Limitations: May require additional endorsements for catastrophic events (e.g., earthquakes, floods). Example: A steel fabricator insures a shipment of I-beams under an all-risk policy. Coverage applies if the load is damaged in a train derailment, regardless of the cause (e.g., track failure, human error).
Named-Peril PoliciesPolicy Selection Criteria:
Definition: Only covers losses specified in the policy (e.g., fire, theft, lightning).
Best Suited For: Bulk materials (e.g., aggregates, lumber) or projects with predictable risk exposures (e.g., residential framing).
Key Features:Coverage Scope: Narrower; requires explicit listing of covered perils. Common named perils include: Fire or explosion. Theft or burglary. Windstorm or hail. Vehicles colliding with stored materials. Exclusions: Extensive; excludes perils not named (e.g., water damage from burst pipes unless added as an endorsement). Deductibles: Lower (e.g., 0.5–2% of insured value) due to higher premiums. Limitations: Requires careful review of peril definitions (e.g., "windstorm" may exclude tornadoes unless specified). Example: A lumber yard insures its stockpile under a named-peril policy covering fire and theft. A flood damages the inventory; the claim is denied unless flood coverage is separately purchased.
Phase-Specific Coverage: Storage, Transit, and Installation
Coverage triggers and claim processes vary by material phase, reflecting differing exposure levels. Below is a step-by-step breakdown of how policies address each phase, including critical transitions (e.g., handover from supplier to contractor):1. Storage Phase
Objective: Protect materials from loss or damage while held at yards, warehouses, or on-site storage.
Coverage Triggers:
2. Transit Phase
Objective: Address risks during movement via truck, rail, ship, or air.
Coverage Triggers:
3. Installation Phase
Objective: Protect materials during integration into the project, including labor-related risks.
Coverage Triggers:
Risk Assessment and Mitigation Strategies for Insurers in Construction Materials Insurance
Construction materials insurance presents unique challenges due to the high-value, often high-risk nature of assets involved in construction projects. Insurers must adopt a multi-layered risk assessment framework that integrates quantitative loss history data with qualitative site-specific evaluations to accurately price policies and mitigate exposure. Effective risk mitigation requires a proactive approach, combining traditional actuarial methods with emerging technologies such as IoT, AI-driven predictive analytics, and geospatial risk modeling. This section outlines a structured methodology for insurers to assess risks, develop mitigation strategies, and compare traditional versus modern risk assessment approaches.Methodology for Assessing Risks in High-Value Construction Materials
A robust risk assessment methodology for construction materials insurance must evaluate both external risks (e.g., theft, weather, logistics failures) and internal risks (e.g., contractor negligence, improper storage). The process involves three core phases: data collection, risk stratification, and dynamic risk scoring."Risk assessment in construction materials insurance is not static; it requires real-time data integration to account for project-specific variables."Data Collection and Integration
Insurers should aggregate data from multiple sources, including:
Risk Stratification Framework
Materials are categorized based on:
Dynamic Risk Scoring Model
A weighted scoring system assigns risk tiers (Low/Medium/High) using:
Mitigation Strategies for Insurers and Policyholders
Mitigation strategies must align with risk profiles and leverage both preventive measures (reducing exposure) and reactive measures (limiting losses). Insurers can design policies with co-insurance clauses, deductible structures, or risk-sharing partnerships to incentivize proactive risk management.Preventive Mitigation Strategies
Insurers can implement or mandate the following measures:
- IoT and Telematics Integration:
- Loss-Prevention Training for Contractors:
Reactive Mitigation Strategies
For scenarios where prevention fails, insurers can structure policies to minimize financial impact:
Comparison of Traditional vs. Modern Risk Assessment Models
Insurers must evaluate whether to rely on legacy actuarial models or adopt data-driven, predictive approaches. Below is a structured comparison with pros and cons for each method."The shift from static risk models to dynamic, real-time analytics is transforming underwriting accuracy and policyholder trust."
| Model Type | Description | Pros | Cons | Best Use Case | ||||||||||||||
|---|---|---|---|---|---|---|---|---|---|---|---|---|---|---|---|---|---|---|
| Traditional Actuarial Tables | Relies on historical loss ratios, industry averages, and manual risk classification (e.g., ISO risk grades for contractors). |
|
|
Low-complexity projects with stable historical data (e.g., residential framing materials). | ||||||||||||||
| Predictive Analytics with Weather/Geospatial Data | Uses machine learning to integrate weather forecasts, crime data, and traffic patterns into risk scores. Example: Adjusting premiums for a project during hurricane season. |
|
|
High-value, high-risk projects (e.g., urban infrastructure with fluctuating crime rates). | ||||||||||||||
| IoT and Telematics-Based Risk Scoring | Deploys sensors and GPS to monitor material condition, location, and handling in real time. Example: Alerts for unauthorized container openings. |
Common Claims Challenges and Resolution StrategiesDisputes over the cause of loss account for 30–40% of construction materials claims, often stemming from ambiguous policy language or conflicting evidence. Below is a responsive table summarizing challenges, root causes, insurer solutions, and measurable outcomes:
Technological Innovations Streamlining Claims ProcessingThe adoption of emerging technologies is transforming claims handling by reducing human error, accelerating investigations, and deterring fraud. Below are key innovations with real-world use cases: |
Leave a Comment
Comments are moderated before appearing. The data you submit is processed according to the Privacy Policy of viralcontentbee.com.